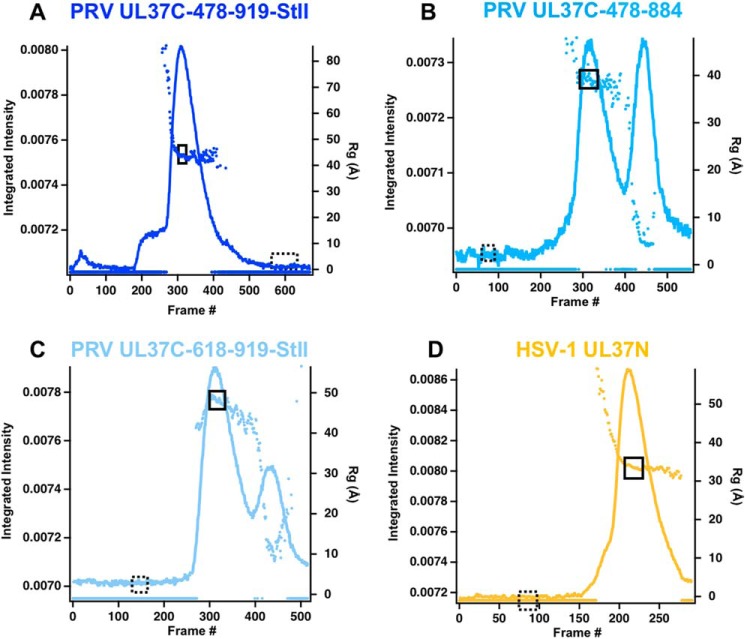
Figure 4.
SEC-SAXS curves. Plots show intensity (colored lines) and Rg (colored dots) as a function of time for the SEC-SAXS run. Buffer frames in the dashed boxes were subtracted from the selected and averaged data frames in the solid boxes for PRV UL37C(478–919)-StII (A), PRV UL37C(478–884) (B), PRV UL37C(618–919)-StII (C), and HSV-1 UL37N (D).

