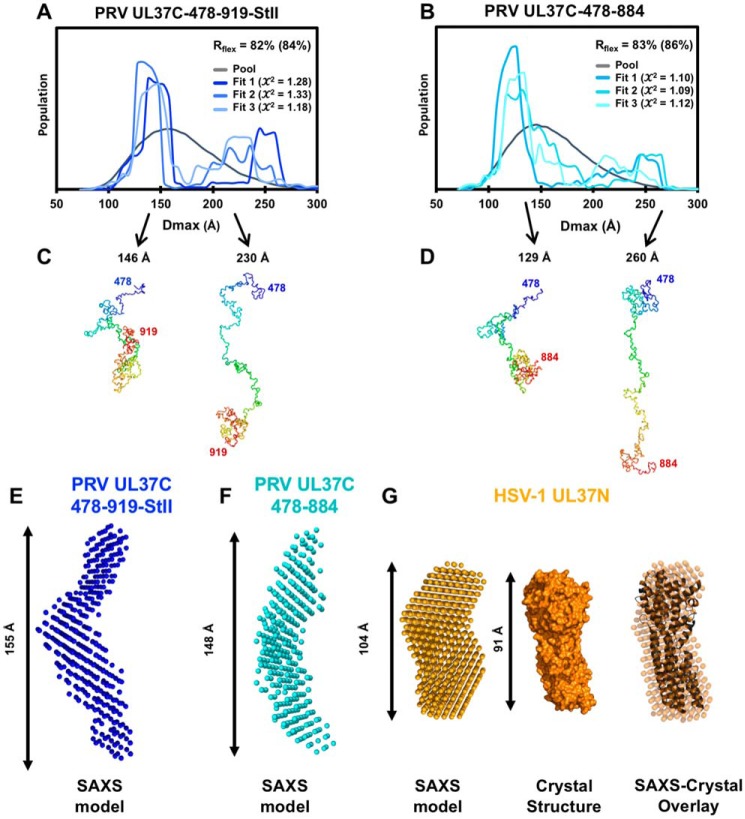
Figure 6.
SAXS modeling of PRV UL37C and HSV-1 UL37N. A and B, EOM of UL37C(478–919)-StII (A) and UL37C(478–884) (B). Each graph shows the Dmax distribution for a pool of 10,000 randomly generated structures and three sets of ensembles that best fit the data. Rflex, which represents flexibility of the ensemble, is shown for the pool, and Rflex for the best fitting curve is shown in parentheses. The structures of the best fit ensemble for PRV UL37C(478–919)-StII (C) and PRV UL37C(478–884) (D) are shown below. These models suggest possible behavior of the flexible protein in solution but do not represent the only solution. E, ab initio bead modeling of PRV UL37C(478–919)-StII. F, ab initio bead modeling of PRV UL37C(478–884). G, ab initio bead modeling of HSV-1 UL37N shown compared with the crystal structure of HSV-1 UL37N (PDB code 5VYL).

