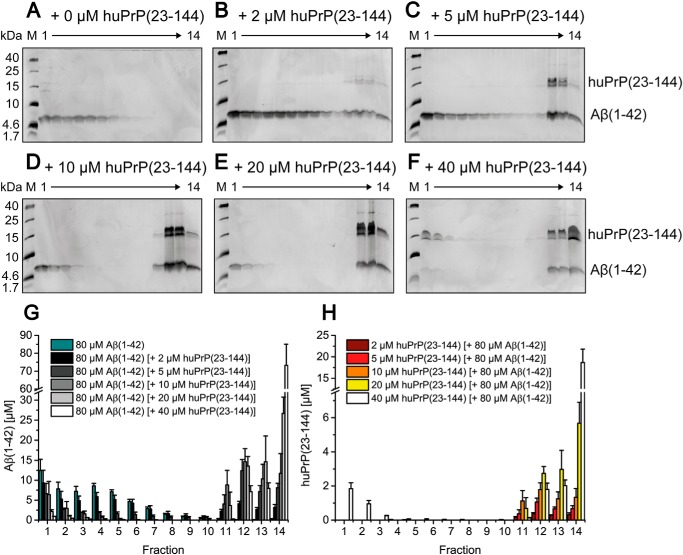
Figure 5.
Formation of heteroassemblies of Aβ(1–42)oligo and huPrP(23–144). Silver-stained Tris/Tricine SDS-PAGE gels after application of 80 μm preincubated Aβ(1–42) with varying huPrP(23–144) concentrations on a sucrose gradient (A–F) and corresponding histograms after RP-HPLC analysis (G and H) show the distribution of Aβ(1–42) and huPrP(23–144). With increasing applied huPrP(23–144) concentrations, Aβ(1–42)oligo (fractions 3–7 in G) decreases. Moreover, both Aβ(1–42) and huPrP(23–144) appear in fractions 11–14 (bottom of the gradient). When 40 μm huPrP(23–144) is added, the Aβ(1–42)oligo–huPrP(23–144) interaction becomes saturated, reflected by the presence of huPrP(23–144) in fractions 1–3 (F and H). Concentrations of Aβ(1–42) according to the applied huPrP(23–144) concentration are shown in G, and concentrations of huPrP(23–144) are shown in H. In addition to silver staining of Tris/Tricine SDS-PAGE gels, dot-blot analysis detecting either Aβ or huPrP of the DGC fractions after application of 80 μm Aβ(1–42) and 40 μm huPrP(23–144) was performed (Fig. S7), confirming qualitative analyses by silver staining of Tris/Tricine SDS-PAGE gels as well as quantitative RP-HPLC analyses. Experiments are done in replicates of n = 5 (for 2 and 10 μm huPrP(23–144) applied) and n = 3 (for 5, 20, and 40 μm huPrP(23–144) applied). Error bars represent S.D.

