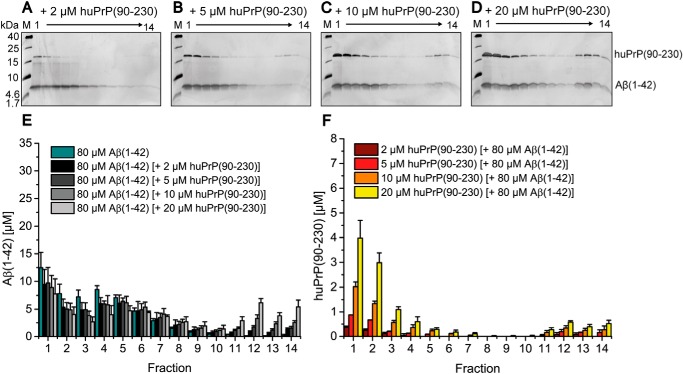
Figure 7.
Impaired formation of heteroassemblies of Aβ(1–42)oligo and huPrP(90–230). Silver-stained Tris/Tricine SDS-PAGE gels after application of 80 μm preincubated Aβ(1–42) with varying huPrP(90–230) concentrations on a sucrose gradient (A–D) and corresponding histograms after RP-HPLC analysis (E and F) show the distribution of Aβ(1–42) and huPrP(90–230). With increasing applied huPrP(90–230) concentrations, just slightly increased protein concentrations of both Aβ(1–42) and huPrP(90–230) are found in bottom fractions 11–14. Concentrations of Aβ(1–42) according to the applied huPrP(90–230) concentration are shown in E, and concentrations of huPrP(90–230) are shown in F. Experiments are done in replicates of n = 3 for all huPrP(90–230) concentrations applied. Error bars represent S.D.

