Figure 1.
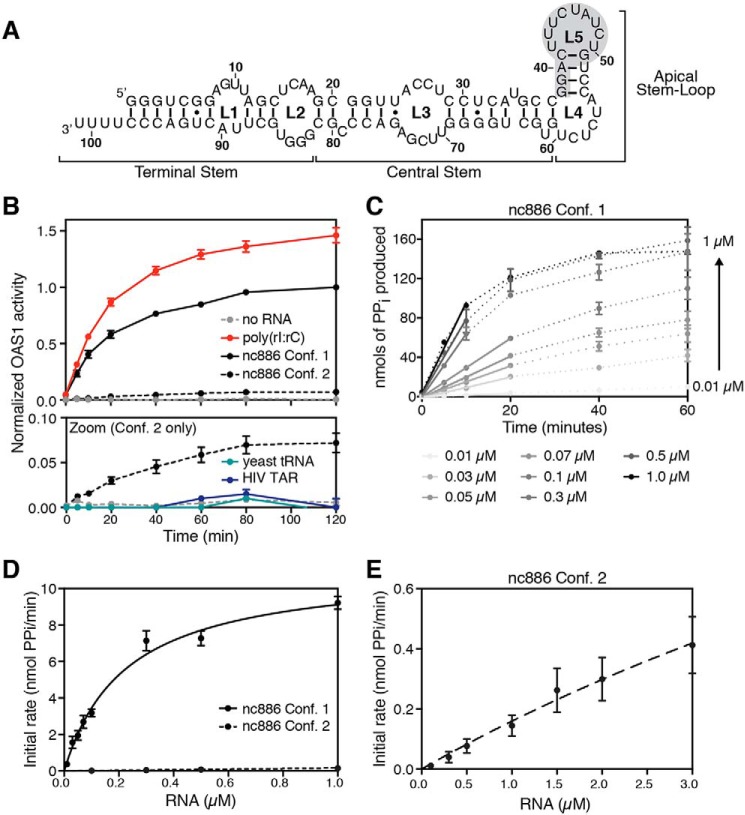
Two nc886 conformers have starkly different abilities to activate OAS1 in vitro. A, nc886 secondary structure and domain organization. The region of predicted tertiary structure present only in conformer 1 is highlighted by gray shading. B, reaction progress curves from an in vitro chromogenic assay of OAS1 activity performed under previously established conditions (27). nc886 conformer 1 (black line) potently activates OAS1, near the levels of activation for the synthetic dsRNA poly(rI·rC) (red line), whereas conformer 2 (dashed black line) only weakly activates OAS1. The lower panel (Zoom) shows a rescaled plot of the same data to highlight the reaction curves for nc886 conformer 2, the background control lacking RNA (dashed gray line), and two unrelated RNAs as control: yeast tRNA (teal line) and HIV TAR (navy line). Data are normalized to nc886 conformer 1. C, example plot of time-course assays with different RNA concentrations to determine initial rates of PPi production. nc886 conformer 1 time-course assay at each RNA concentration is shown by dotted lines. Data were fit using linear regression analysis on the first 10–20 min of the reaction to obtain the initial rate (slope of the line) used in kinetic analysis. D, kinetic analyses of OAS1 activation over a range of nc886 RNA concentrations. Data were fit using nonlinear regression analysis to obtain the kinetic parameters Vmax and Kapp as described in the text. E, rescaled plot of initial rates of PPi production determined from time-course assays plotted versus RNA concentration shown to highlight the data for the weakly activating nc886 conformer 2.

