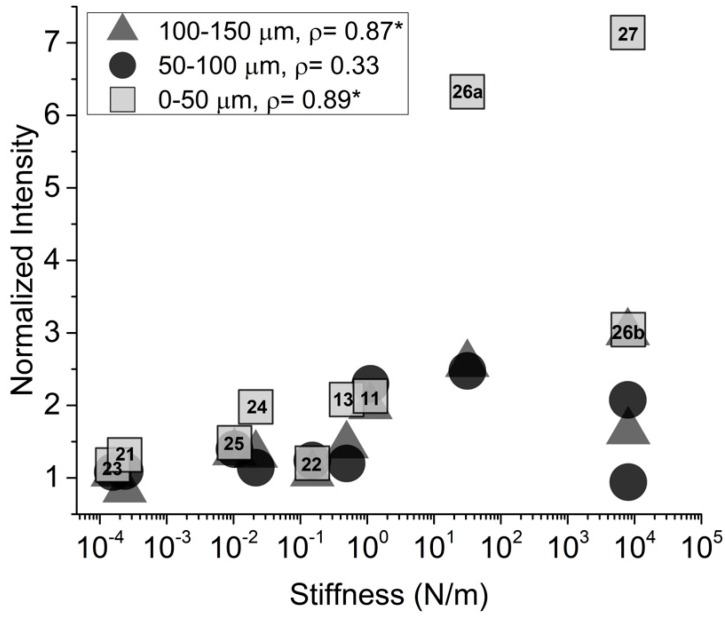
Figure 4.
GFAP intensity analysis from GFAP-stained fluorescent images. Normalized intensity as a function of device stiffness three concentric 50 µm bands from device perimeter. * p < 0.05. Numbers indicate reference from Table 1. References are only included for 0–50 µm data, but all points aligned vertically are from the same reference. 26a and 26b reference the 50 µm and 200 µm stainless steel devices, respectively.

