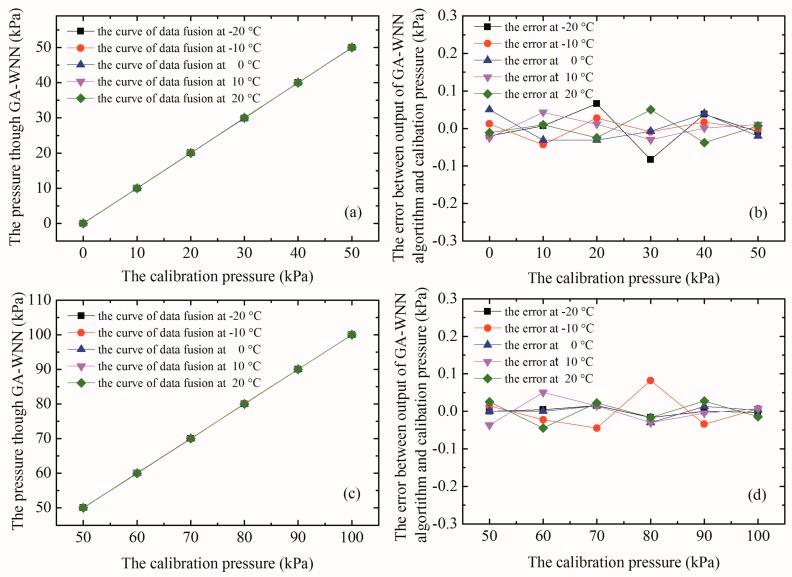
Figure 19.
(a) The relationship curves between the corrected pressures of PS1/PS2 sensor and the calibration pressures with pressure from 0–50 kPa; (b) the absolute error between the corrected pressures of PS1/PS2 sensor and the calibration pressures at different temperature; (c) the relationship curves between the corrected pressures of PS3/PS4 sensor and the calibration pressures with pressure from 50–100 kPa; and (d) the absolute error between the corrected pressures of PS3/PS4 sensor and the calibration pressures at different temperature.

