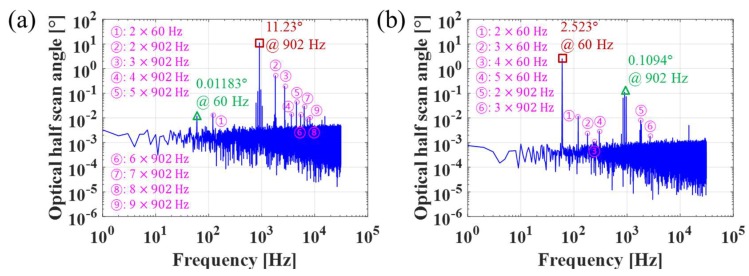
Figure 9.
Crosstalk analysis in frequency domain. (a) Fast axis; (b) slow axis. The data was obtained when the scanner was oscillating with the maximum scan angles at 902 Hz and 60 Hz for the fast and slow axes, respectively. Rectangle (brown color), triangle (green color), and circle (pink color) represent actuation signal of one axis, coupled signal affected by the other axis, and the nth harmonics, respectively. Note that electrical noise at 60 Hz is negligible (0.1% of actuation signal at 60 Hz), which was verified by the FFT processing of data without slow-axis actuation.

