Figure 5.
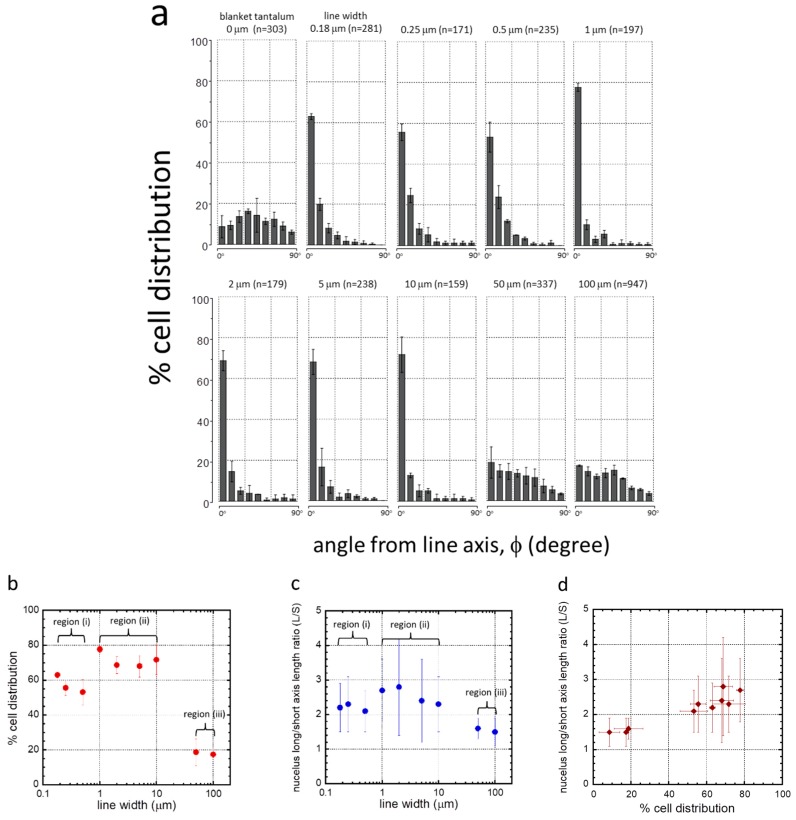
(a) Plots of cell orientation (ϕ) distribution in percentage on 0.18, 0.25, 0.5, 1, 2, 5, 10, 50, and 100 μm-wide line comb structures. As a comparison, this figure includes measurements from blanket tantalum films. The number of cells inspected (n) on each pattern is displayed in an individual chart. Each bar represents a 10° bin of deviations from the line axis in either clockwise or anti-clockwise directions. For example, a cell nucleus deviated from line axis of –22° would fall into the third bin of each plot. These results show that most adherent cells are aligned to the line axes on comb structures in the range of 0.18 to 10 μm. Adherent cells orientations are increasingly randomized on comb structures with line widths of 50 and 100 μm. (b) Percent cell distributions that aligned within ±10° of the comb structure line axes. (c) Plot of ratio of nucleus long and short axes as a function of comb structure line widths. (d) Plot of nucleus axis length ratio (L/S) as a function of percent cell distribution aligned within ± 10° of line axes.

