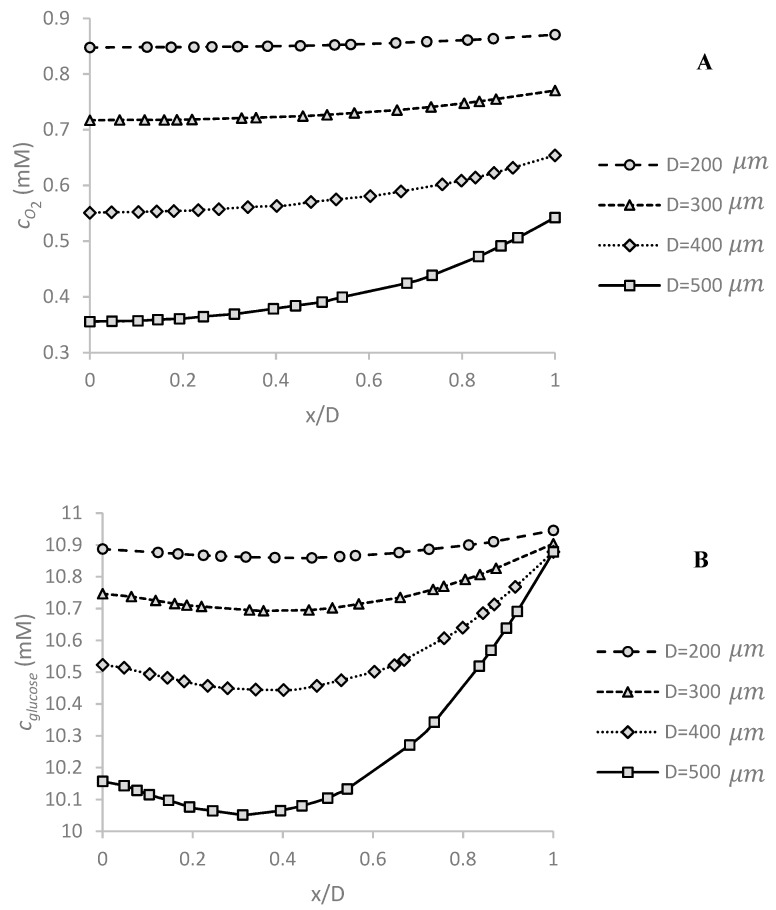
Figure 4.
The effect of spheroid diameter D on (A) oxygen and (B) glucose concentration profiles in the center of spheroid along x-axis (function of dimensionless x position: x/D). The maximum oxygen and glucose concentration difference in the spheroid increases, respectively from ~3% to ~52% and from ~1% to ~8% as the spheroid diameter increases from 200 μm to 500 μm. The simulations are done under Q = 5 μL/min, and .

