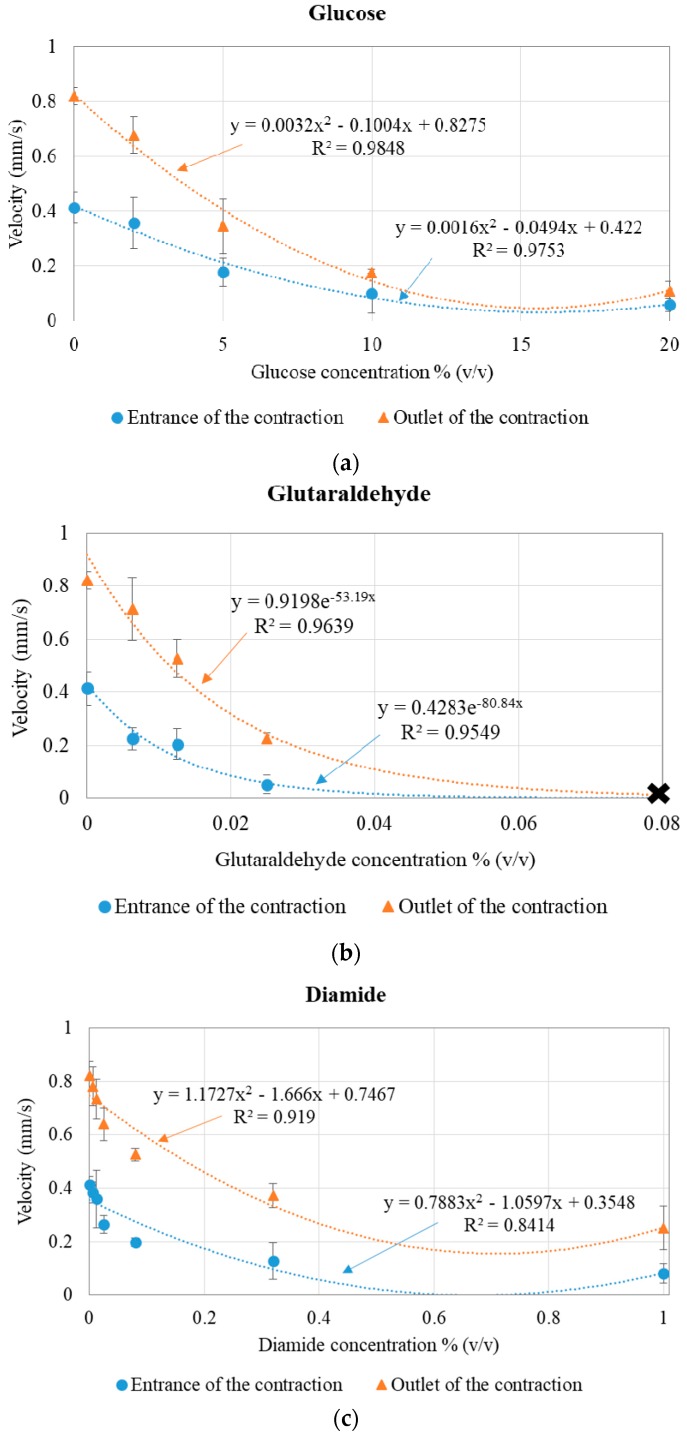
Figure 6.
Velocity (mm/s) and error bars for healthy and (a) glucose-, (b) glutaraldehyde-, and (c) diamide-modified RBCs, at the entrance (blue series) and at the outlet (orange series) of the microchannel contraction and trend lines. In (b), the X represents the clogging of the microchannel, with no deformability or velocity data.

