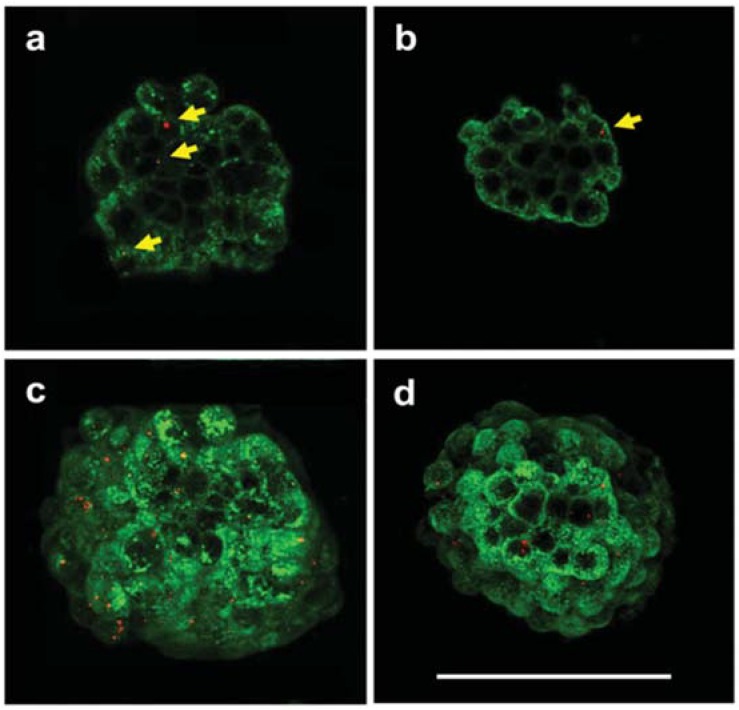
Figure 4.
Confocal fluorescence imaging of two stages of development of quiescent cancer stem cell mammospheres labeled with FNDs. (a,c) primary stage and (b,c) secondary stage. Both mammospheres were stained with a cell membrane marker, Fluorescein IsoThioCyanate (FITC)-conjugated wheat germ agglutinin (green), and FNDs appear as the sparse red dots in cells. (a,b) single-section images, and (c,d) maximum projection images of a stack. Yellow arrows indicate the internalized FNDs. Scale bar: 100 µm. Reprinted with permission [73]. Copyright (2015) Wiley-VCH.

