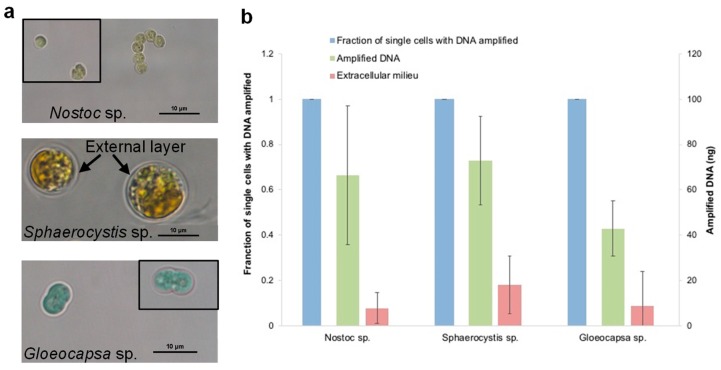
Figure 9.
(a) Microscopic images of Nostoc sp., Sphaerocystis sp. and Gloeocapsa sp. The black boxes indicate additional cells from another capture to representatively illustrate cells in suspension. (b) The use of the developed lysis protocol on Sphaerocystis sp. and Gloeocapsa sp. for lysis and SC-WGA. N = 10 single cells per species per condition; error bars represent standard deviation. Each set of experiment was repeated three times. The sterile PBS as a true negative control did not show any contamination after amplification (not shown in the graph).

