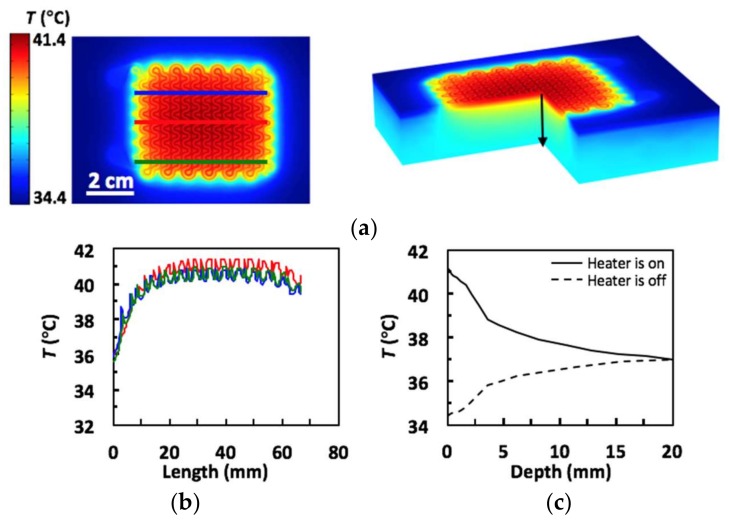
Figure 4.
(a) COMSOL thermal simulation results (left: top view; right: 3D view); (b) Lateral heat distribution of heater. Blue, red and green lines on simulation image (left) mark the horizontal line across which temperature was collected for their respective red, blue and green plots; (c) Vertical heat distribution of skin from the black line on simulation image (right).

