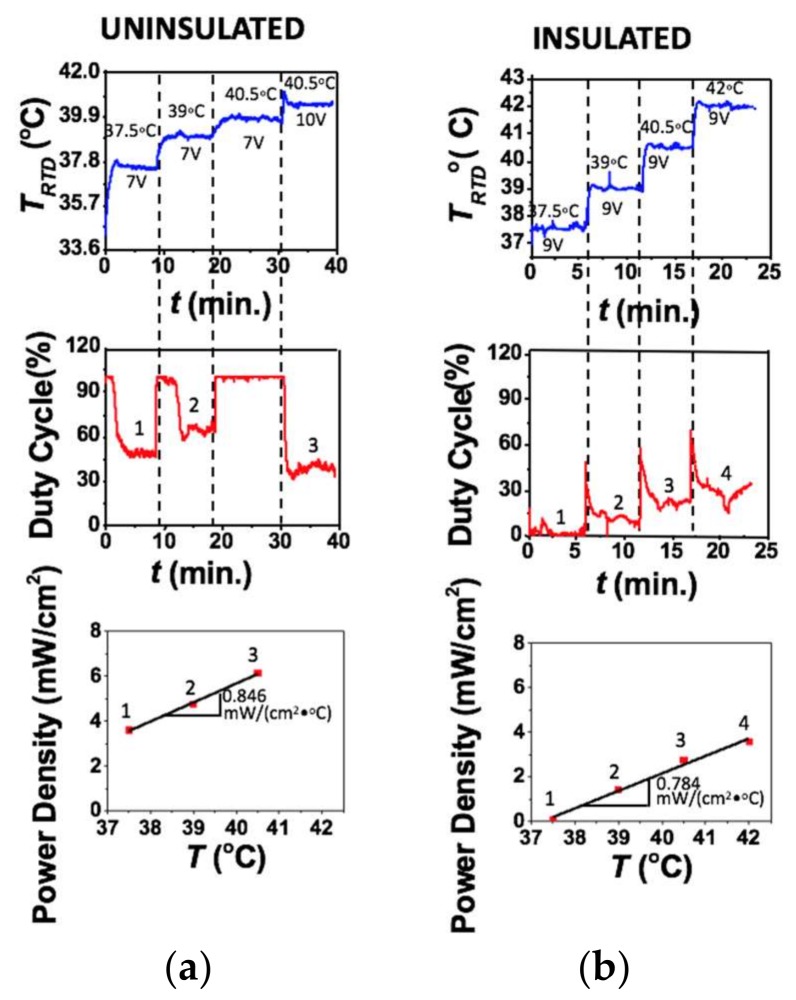
Figure 6.
(a) Plot of heater temperature versus time as the set points and voltages are changed, followed by a plot of the corresponding duty cycle versus time. The average of the steady state duty cycles marked 1, 2 and 3 were used to calculate the power densities plotted below marked 1, 2 and 3, respectively, at different temperatures; (b) The same plots as figure A except the heater is insulated with a piece of foam.

