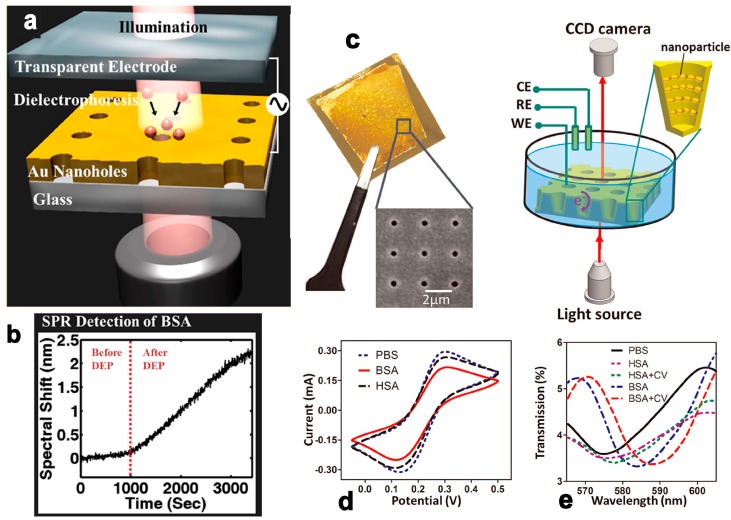
Figure 5.
Schematic of the experimental setup for dielectrophoretic concentration of analyte molecules (a) and spectral shift of BSA’s SPR detection (b). Reprinted with permission from [47]. Copyright (2014) ACS; The nanoCA for electrochemical and LSPR measurement (c) and Transmission spectrum (d) of nanoCA with PBS, 100 μg/mL HSA and HSA plus CV scanning, 100 μg/mL BSA and BSA plus synchronous CV scanning and statistic (e) for shifts in dip wavelength of HSA, HSA plus CV, BSA and BSA plus CV. Reprinted with permission from [49]. Copyright (2015) Elsevier.

