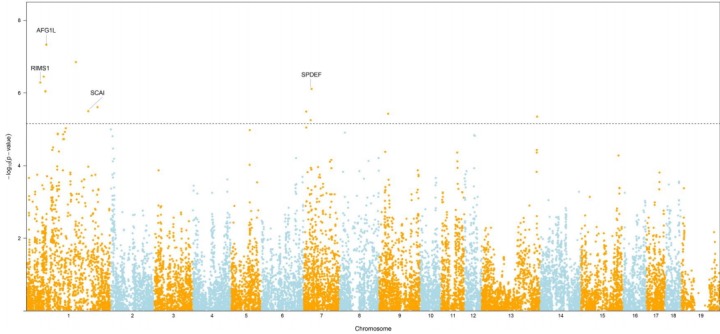
Fig. 1.

Mahattan plot showing the −log10(p-value) for backfat thickness across chromosomes in Landrace and Yorkshire pigs in Korea. The horizontal dotted line represents an false discovery rate of 0.01.

Mahattan plot showing the −log10(p-value) for backfat thickness across chromosomes in Landrace and Yorkshire pigs in Korea. The horizontal dotted line represents an false discovery rate of 0.01.