Fig. 2.

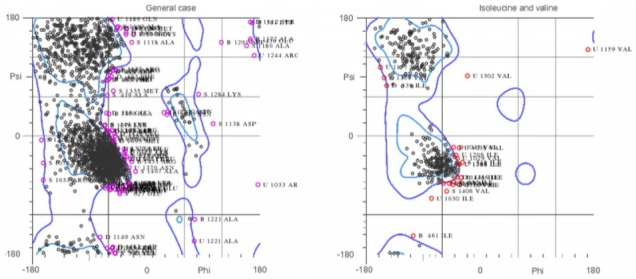
Ramachandran plot of DNA gyrase structure. The plot is showing the major region of the structure lies within the favored and allowed region.

Ramachandran plot of DNA gyrase structure. The plot is showing the major region of the structure lies within the favored and allowed region.