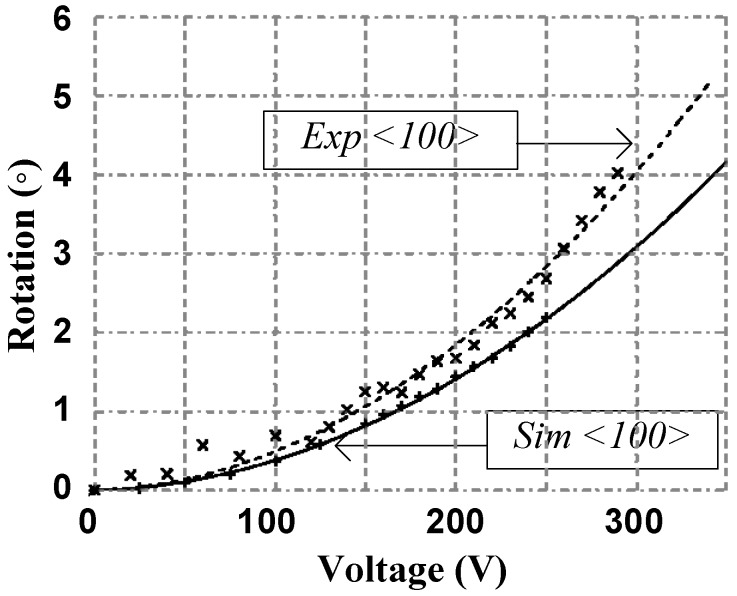
Figure 8.
Measured and simulated platform angular displacement of the second design with fitting curves where the “+” data points represent simulated data, the solid line is a fit to the simulated data, the “×” data points represent experimental measurements, and the dotted line is a fit to the experimental measurements.

