Figure 3.

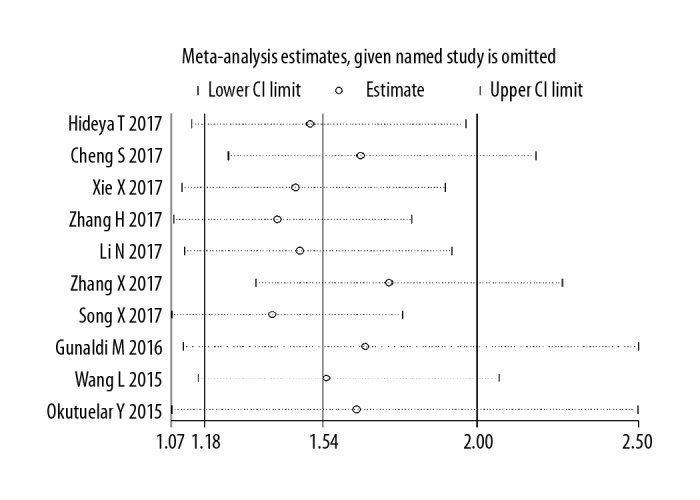
Forest plot of sensitivity analysis for influence of PDW level on OS with HR and 95%CI. HR >1 indicates worse survival for the group.

Forest plot of sensitivity analysis for influence of PDW level on OS with HR and 95%CI. HR >1 indicates worse survival for the group.