Figure 2.
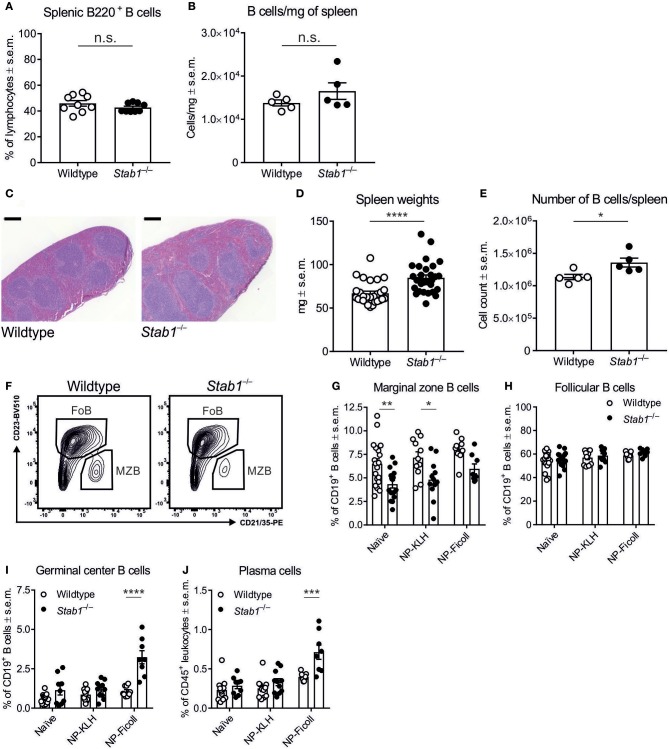
Stab1−/− mice have enlarged spleens and altered B cell populations. (A,B) Frequencies of B220+ B cells in the spleen (A) and B cell number per mg of spleen (B) in wildtype and Stab1−/− mice. (C–E) Representative hematoxylin/eosin–stained spleen sections (scale bar, 200 μm) (C), spleen weights (D), and the absolute numbers of B cells per spleen (E) in wildtype and Stab1−/− mice. (F–H) Representative gating (F) and the frequencies of splenic MZB (CD19+ CD23low CD21/CD35+) (G) and FoB (CD19+ CD23+ CD21/35low) (H) in naïve and NP-KLH- or NP-Ficoll-immunized mice. (I,J) Frequencies of splenic GCB (CD19+ Fas+) (I) and PC (CD45+ CD19− CD138high) (J) naïve and NP-KLH- or NP-Ficoll-immunized mice. (A,B,D,E,G–J) Each data point represents one mouse and bars represent the means ± s.e.m., n = 9 (wildtype and Stab1−/−) (A), 5 (wildtype and Stab1−/−) (B), 28 (wildtype) and 29 (Stab1−/−) (D), 5 (wildtype and Stab1−/−) (E), 9–19 (wildtype) and 8–16 (Stab1−/−) (G, H) and 9–14 (wildtype) and 8–11 (Stab1−/−) (I, J). Statistical significance was determined with Student's unpaired two-tailed t-test (A,B,D,E) or two-way ANOVA followed by Bonferroni's multiple comparisons tests (G–J), *P < 0.05, **P < 0.01, ***P < 0.001, ****P < 0.0001, n.s. not significant.

