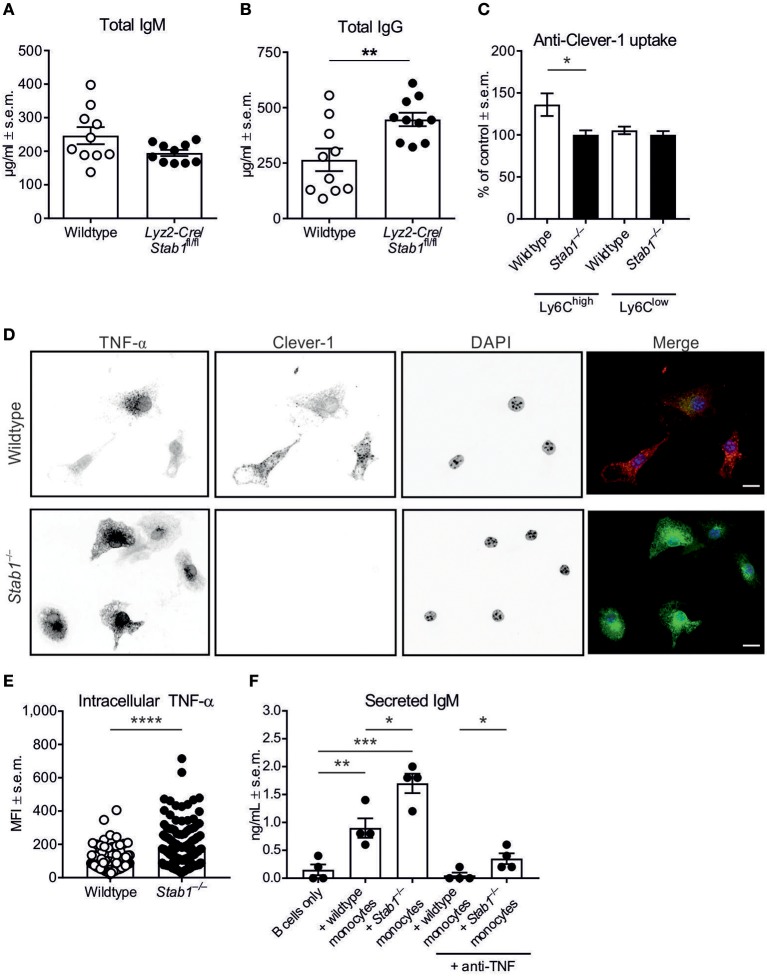
Figure 4.
Stab1−/− monocytes induce enhanced antibody production by B cells. (A,B) Baseline plasma concentrations of IgM (A) and IgG (B) in Lyz2-Cre/Stab1fl/fl mice and control mice. (C) Uptake of fluorescently-conjugated anti-Clever-1 antibody by Ly6Chigh and Ly6Clow monocytes from naïve mice. MFI values have been normalized to unspecific antibody uptake by the corresponding Stab1−/− monocyte populations, which have been set at 100%. (D) Representative immunofluorescence images of wildtype and Stab1−/− M2 macrophages treated with LPS and brefeldin A for 5 h. In the merged images, nuclei are shown in blue, TNF-α in green and Clever-1 in red (scale bar, 10 μm). (E) Quantification of TNF-α mean fluorescence intensities (MFI) per cell from (D). The quantification is representative of three independent experiments. (F) Concentrations of secreted IgM as determined by ELISA from co-culture supernatants. Wildtype B cells were cultured with or without bone-marrow-derived monocytes/macrophages from wildtype or Stab1−/− mice as indicated. (A–C,E,F) Each data point represents one mouse (A–C) or one cell (E,F) and bars represent the means ± s.e.m., n = 10 (wildtype and Stab1−/−) (A, B), 4 (wildtype and Stab1−/−) (C), 118 (wildtype) and 140 (Stab1−/−) (E) and 4 per condition (F). Statistical significance was determined with Student's unpaired (A–C,E) or paired (F) two-tailed t-test with Welch's correction when applicable (A), *P < 0.05, **P < 0.01, ***P < 0.001, ****P < 0.0001.

