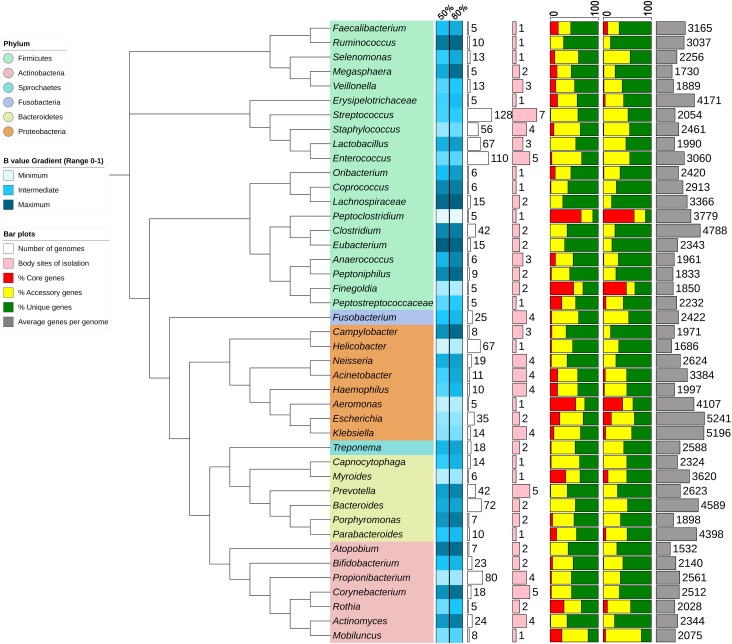
FIGURE 2.
Summary of pan-genome statistics for selected genera. The Neighbor Joining phylogenetic tree is constructed using 16S rRNA genes from representatives of each taxon. The B values are depicted as heatmap and the percentages of core, accessory and unique genes as stacked bar plots for each taxon using 50 and 80% sequence identity cut-offs. The plot and heatmap are constructed by iTOL web server using statistics calculated from PanGFR-HM.

