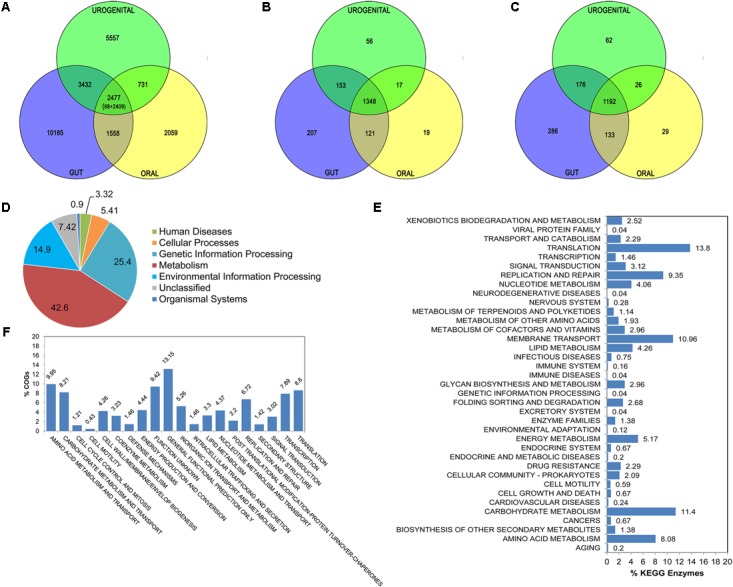
FIGURE 3.

Comparative analysis for Lactobacillus strains from gut, oral cavity and urogenital tracts. Venn diagrams depict the number of gene families (A), COG proteins (B) and KEGG enzymes (C) at three body-sites. Distribution of major KEGG functional categories for 1192 core enzymes is shown as pie chart (D). Bar plots are created in order to illustrate the distribution of detailed core functional KEGG enzymes (E) and COG proteins (F).
