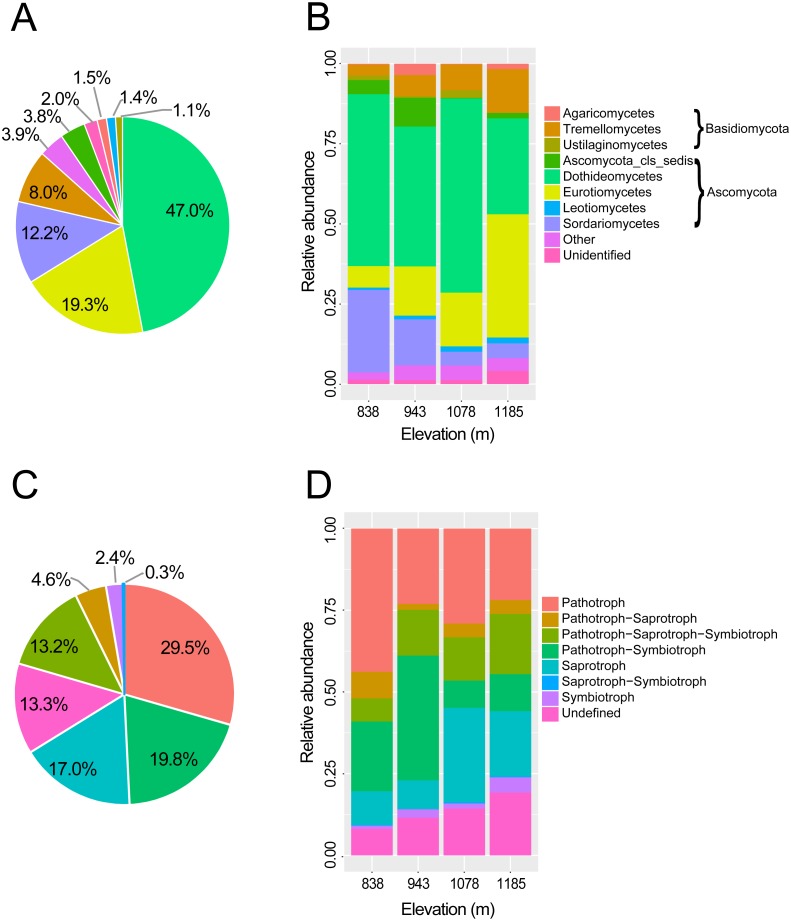
Figure 2. Taxonomic composition and trophic guilds of the fungal communities.
Pie charts showing the distribution of sequences of (A) fungal classes and (C) fungal trophic guilds. Bar charts showing the taxonomic composition of the phyllosphere fungal communities in four elevation sites at (B) taxonomic class level and (D) tropic guilds. The fungal classes with a relative abundance of <0.1% were classified to “other”.

