Figure 2.
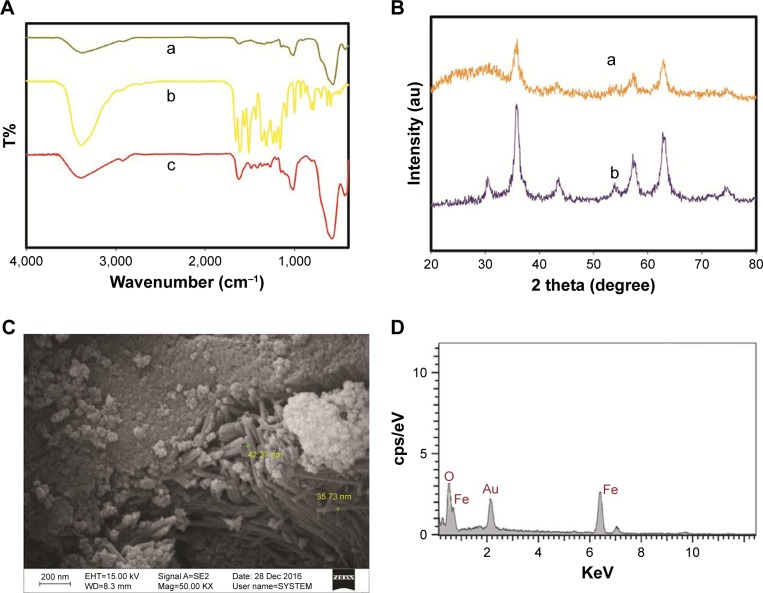
Characterization of QC-Fe3O4. FT-IR spectra for the (A) dextran-coated, (B) pure QC, and (C) QC-conjugated Fe3O4 nanoparticles (A). XRD pattern of the (A) dextran-coated and (B) QC-conjugated Fe3O4 nanoparticles (B). Scanning electron microscopy image of QC-conjugated Fe3O4 nanoparticles (C). Scanning electron microscope-EDX spectrum of QC-conjugated Fe3O4 nanoparticles (D).
Abbreviations: FT-IR, Fourier transform infrared; QC, quercetin; XRD, X-ray diffraction.

