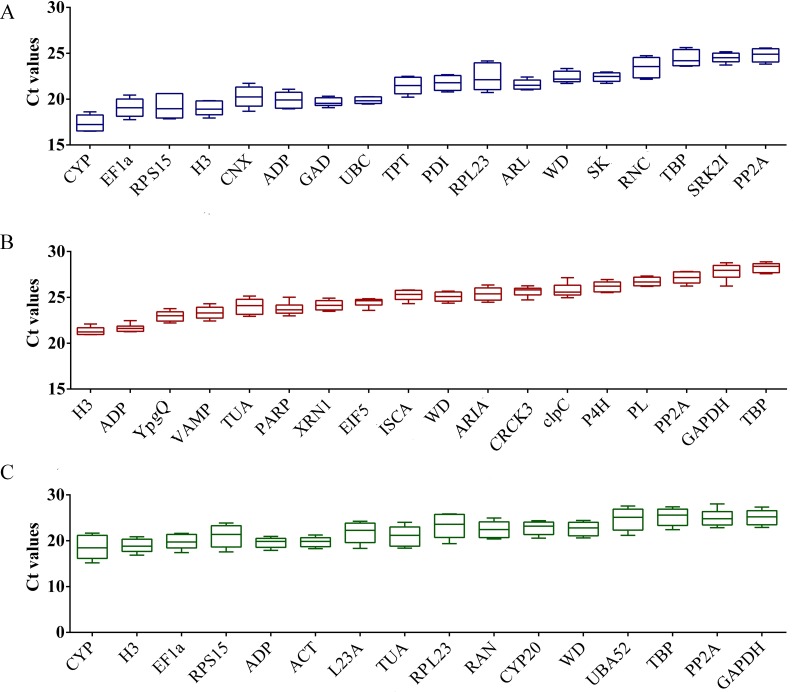
Figure 1. Expression intensity of candidate RGs in healthy control and CGMMV-infected samples of bottle gourd.
(A) Bottle gourd leaves indicated in blue color; (B) bottle gourd fruits indicated in red color; (C) bottle gourd leaves and fruits indicated in green color. Values are given as Cq (mean of triplicate samples) and are inversely proportional to the amount of template. The box indicates the 25th and 75th percentiles. Whiskers represent the maximum and minimum values. The thin line within the box marks the median.

