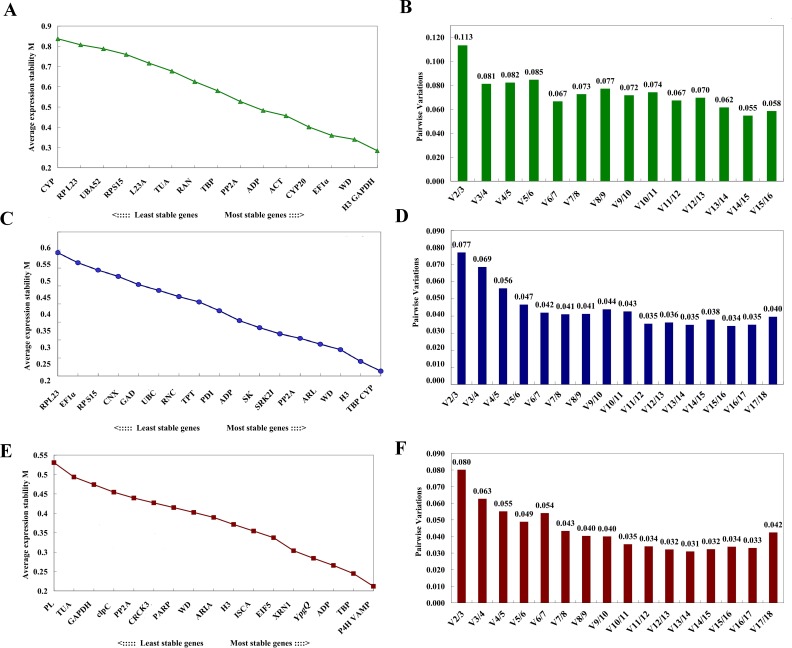
Figure 3. Expression stability of the candidate RGs analyzed by geNorm.
M represents the stability value. M of RGs screened from RNA-Seq in both bottle gourd leaves and fruits (A), and Vn/Vn+1 of the universal RGs in both bottle gourd leaves and fruits (B); M of RGs screened from RNA-Seq in bottle gourd leaves (C), and Vn/Vn+1 of RGs screened from the RNA-Seq in bottle gourd leaves (D), M of RGs screened from RNA-Seq in bottle gourd fruits (E), and Vn/Vn+1 of the universal RGs in bottle gourd fruits (F).

