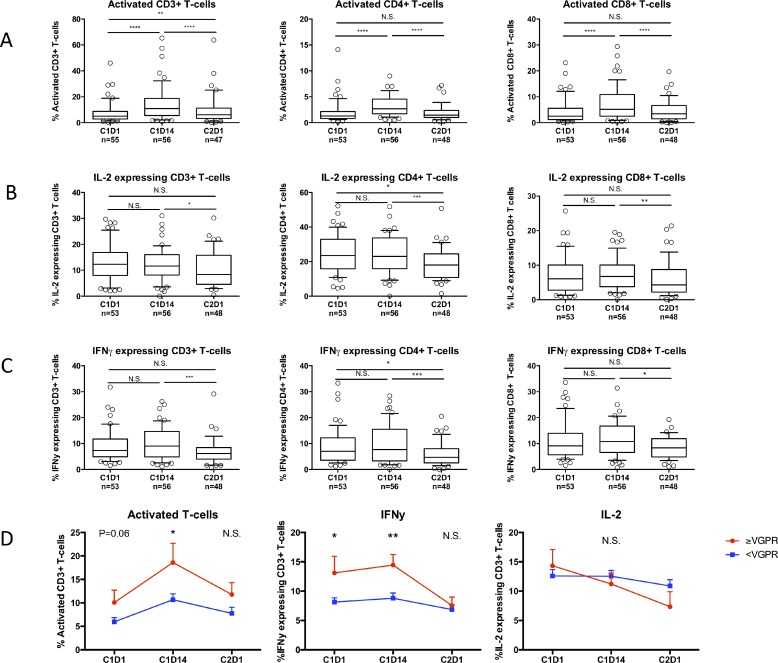
Figure 3. Effects of REP treatment on T-cell activation and cytokine production in lenalidomide-refractory patients.
PBMCs were obtained before start of cycle 1 (C1D1), mid-cycle (C1D14) and before start of cycle 2 (C2D1). (A) Change in frequencies of activated (HLA-DR+) T-cells during REP treatment. (B, C) Changes in expression of IL-2 (B) and IFNg (C) in T-cells during REP treatment. Boxes represent first and third quartile with median value, and error bars represent p10 to p90. (D) Change in activated (left panel), IFNg producing (middle panel) and IL-2 producing (right panel) T-cells in patients with a response ≥VGPR (red) versus <VGPR (blue) during REP treatment. Shown are mean ± SEM. P-values were calculated using the Wilcoxon matched pairs, signed rank tests (A, B, C) and T-tests (D). *P < 0.05, **P < 0.01, ***P < 0.001, ****P < 0.0001, N.S. not significant.

