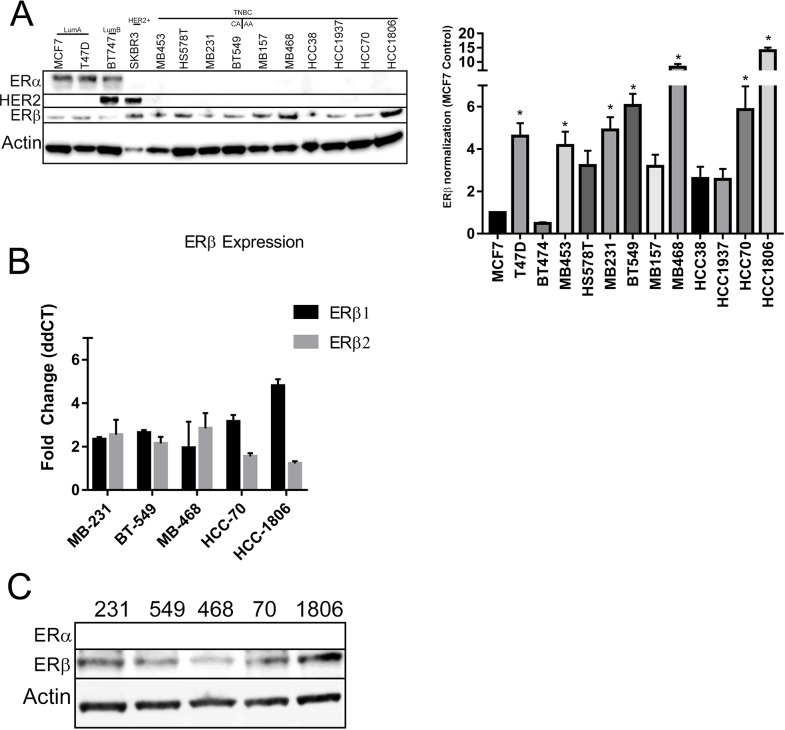
Figure 2. ERβ is expressed in TNBC cell lines.
(A) The indicated panel of breast cancer cell were maintained in growth media with 10% FBS and protein was extracted until the cells reach to 80% confluence. Western blot analyses were performed with ERα, ERβ1 and HER2 antibodies and β-actin antibody was used for loading control (A-right). The western blot of ERβ1 was repeated 3 times and the bands intensities were adjusted to β-actin. The bar graph (A-left) showed the mean intensities from three independent bots and SD for the indicated cell lines. “*” indicated p<0.05 compared to the intensity from MCF-7 cells and determined by one-way ANOVA. (B) The indicated TNBC cells were grown in phenol red free media with 5% charcoal treated FBS until 80% confluence and RNA was extracted. RT-qPCR was performed with ERβ1 and ERβ2 primers and adjusted to GAPDH. The bar graph presented as fold changed of ERβ1 and ERβ2 levels in the indicated TNBC cells compared to MCF-7 cells. Each bar indicated mean±SD from three experiments. (C) The indicated TNBC cells were grown in phenol red media with 5% charcoal treated FBS until 80% confluence and protein was extracted. Western blot analyses with ERα and ERβ1 antibodies were performed and β-actin was used for loading control.

