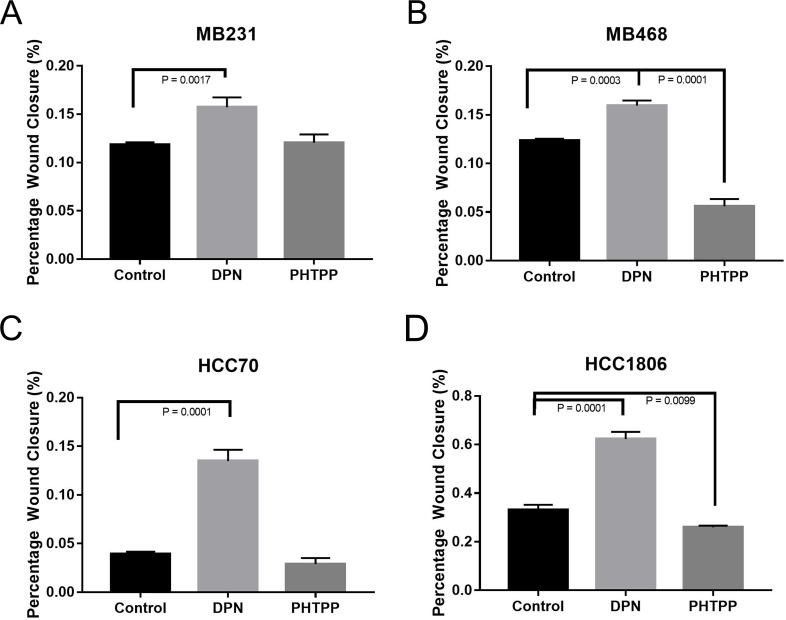
Figure 3. Activation of ERβ increases migration of TNBC cells.
The cells were seeded in 8.5cm3 dishes with a 2 well silicone insert and treated with or without DPN or PHTPP for 24 hrs as described in methods. The wound closure was monitored and images were taken and analyzed from three different rears for each conditions. The bar graphs for MB231 (A), MB468 (B), HCC70 (C) and HCC1806 (D) presented as percentage wound closures (mean ±SD) for each conditions. P-values between the indicated conditions were determined by one-way ANOVA.

