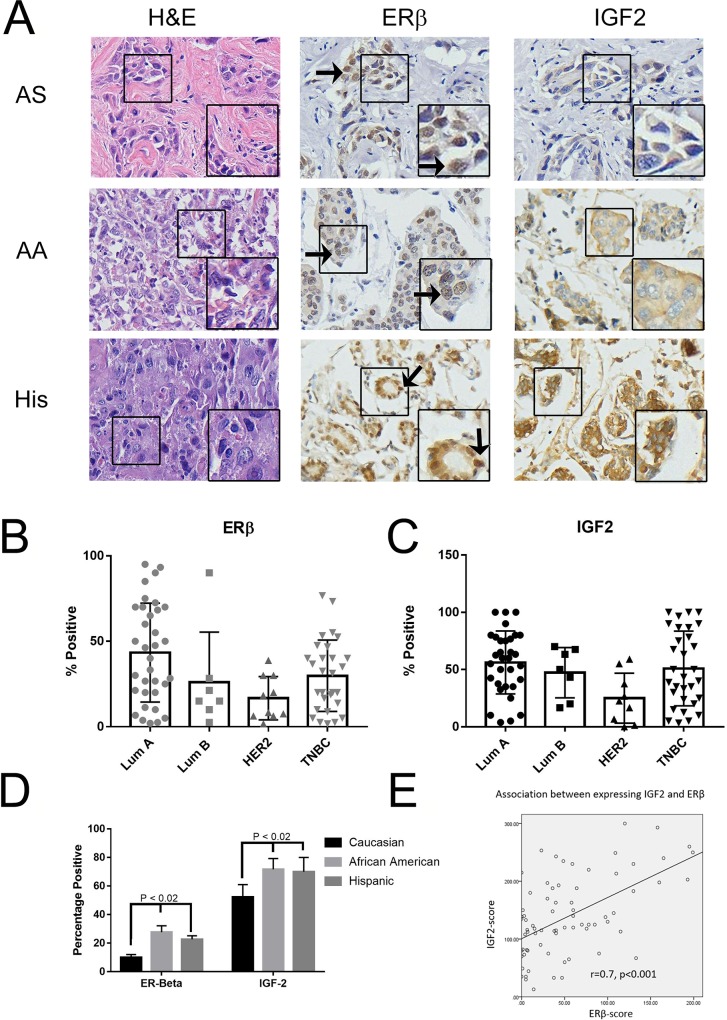
Figure 8. ERβ is expressed in breast cancer patients' tissue microarray.
(A) Immunohistochemical (IHC) analysis was used to determine ERβ1 and IGF2 expression in breast cancer primary tissues as described in methods. Represented images from IHC of H&E, ERβ1 and IGF2 in TNBC from Asian (AS), African American (AA), and Hispanic/Latina (His) patients were shown. (B and C) Bar graphs showed quantified IHC data of ERβ1 (B) and IGF2 (C) expression in different subtypes of breast cancer. The bars indicated percentage of positive staining for ERβ1 or IGF2 (mean ±SD) in the indicated subtype of breast cancers. (D) IHC data of ERβ1 was quantified and the bars indicated percentage positive expression of ERβ1 in the indicated racial ethnicities. (E) The correlation between expressing ERβ and IGF2 in patients was evaluated by Bivariate Correlations with two tailed test, performed with SPSS v.22.

