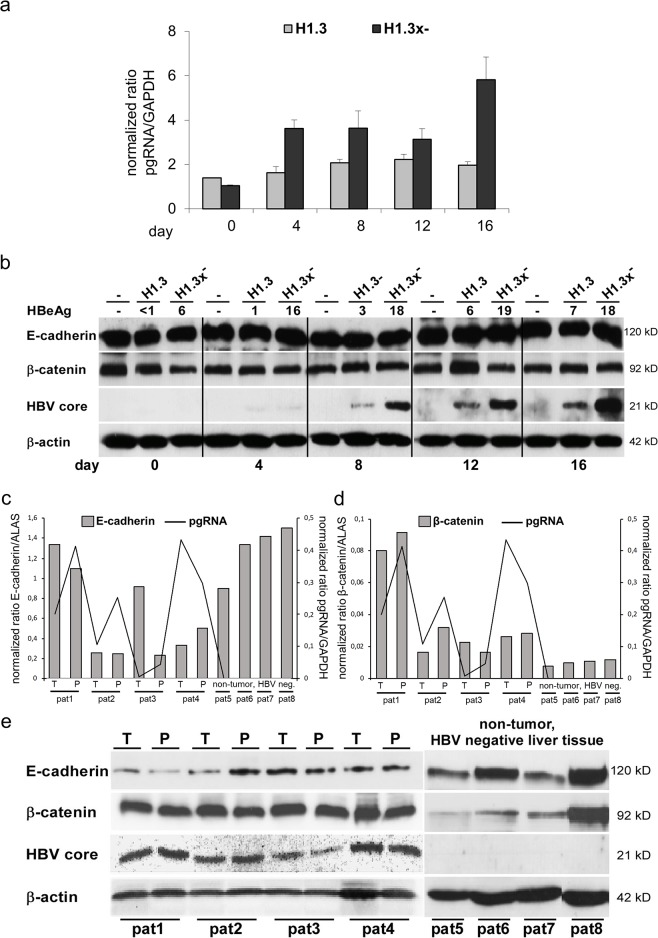
Figure 1. Total protein levels of E-cadherin/β-catenin in HBV-replicating hepatoma cells and mRNA expression/total protein levels of E-cadherin/β-catenin in human liver tissue (HBV-infected and HBV-negative).
(a) HBV pgRNA (quantified by real-time PCR) in stably transfected HBV-producing HepG2 cell lines (H1.3 and H1.3x–) in a time course experiment. Day 0 was defined as day when cells were 80-90% confluent (here: 2 days post plating). mRNA and proteins were extracted at day 0, 4, 8, 12 and 16. Normalized expression ratios relative to housekeeping gene GAPDH are given. The assays were performed in independent triplicates, means + SD are shown. (b) Western blot analysis of E-cadherin, β-catenin and HBV core protein (same time course experiment) in parental (−) and stably transfected HBV-producing HepG2 cells (H1.3 and H1.3x–). HBeAg levels in cell culture supernatants are given in ng ml-1. β-actin was stained as loading control. (c) E-cadherin mRNA and (d) β-catenin mRNA as well as HBV pgRNA were quantified by real-time PCR in liver tissue of paired tumor (T)/peritumur (P) tissue samples of four HBV-infected human livers with HCC (pat1-pat4) and four non-tumor, HBV-negative livers (pat5-pat8). Normalized expression ratios relative to house keeping gene ALAS and GAPDH are given. (e) Western blot analysis of E-cadherin, β-catenin and HBV core protein of the same liver tissue lysates of paired tumour (T)/peritumour (P) tissue samples of four HBV-infected human livers with HCC (pat1-pat4) and four non-tumor, HBV-negative livers (pat5-pat8). β-actin was stained as loading control.

