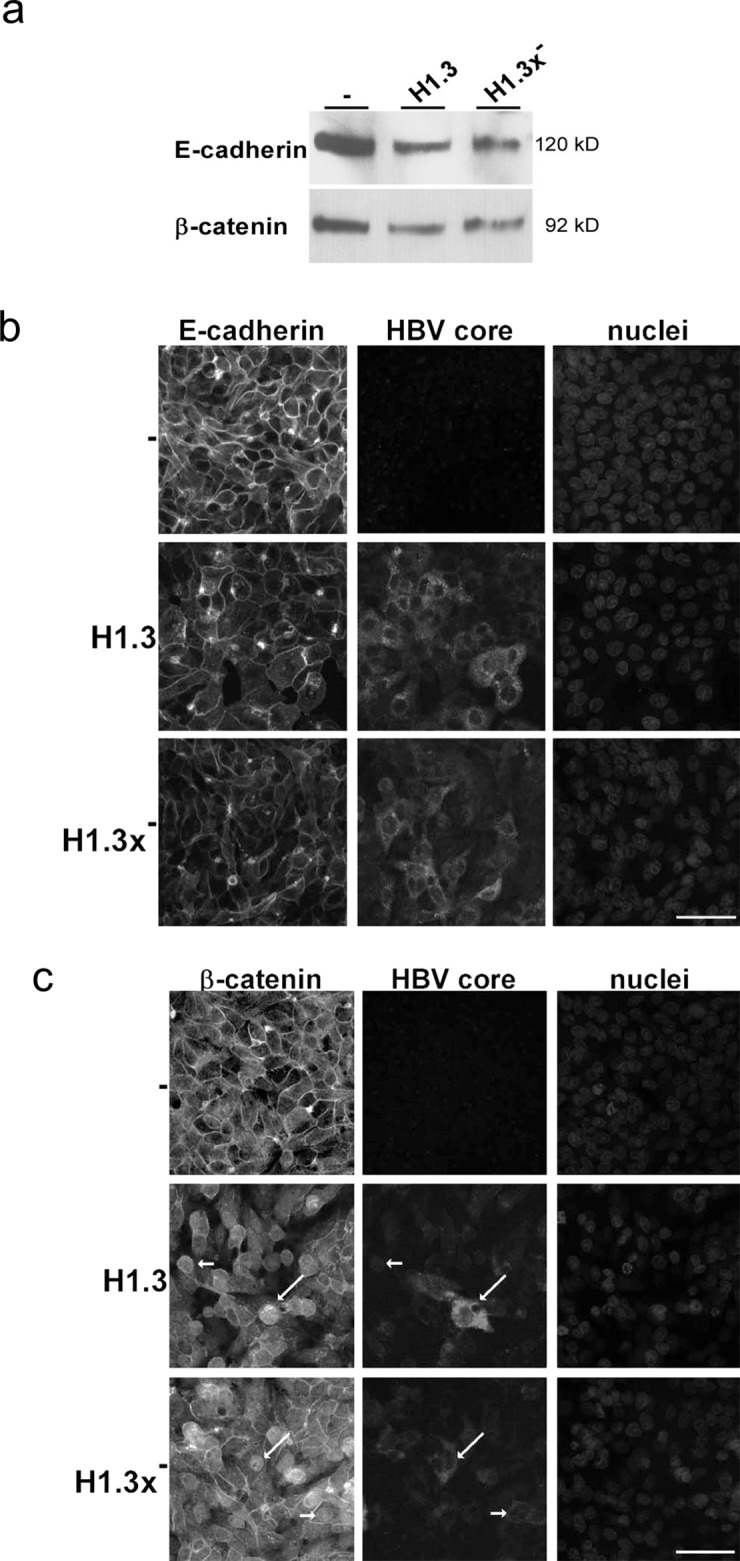
Figure 2. Distribution of E-cadherin/β-catenin in HBV-replicating hepatoma cells.

(a) Membrane fractions (isolated via a cell surface biotinylation assay) of E-cadherin and β-catenin in HBV-producing (H1.3 + H1.3x−) compared to parental (−) HepG2 cells were analyzed by Western blot. Immunoflourescence staining of (b) E-cadherin and (c) β-catenin (nuclear translocation indicated by arrows) in parental (−) and HBV-producing (H1.3 + H1.3x−) HepG2 cells. Co-staining of HBV core protein (indicated by arrows) and nuclei. Scale bars indicate 40μm.
