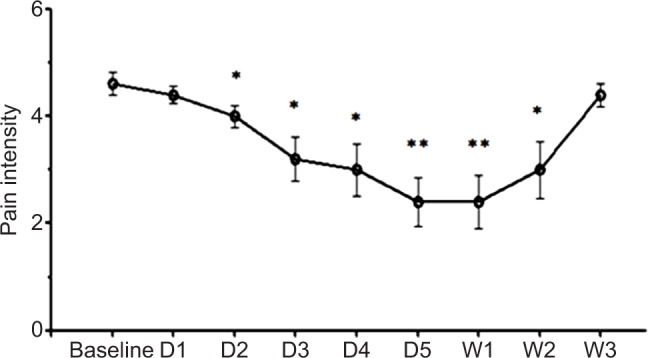
Figure 2.

Effects of tDCS treatments on pain intensity.
Notes: Data are presented as the means of NRS at baseline (before tDCS) and after various time points after treatment on D1, D2, D3, D4, D5, and 1, 2, 3 weeks after 5 consecutive days of tDCS. Vertical lines represent SEM. Significant differences from baseline are represented by *P<0.05 and **P<0.01.
Abbreviations: D, day; NRS, 0–10 numerical rating scale; tDCS, transcranial direct current stimulation; W, week.
