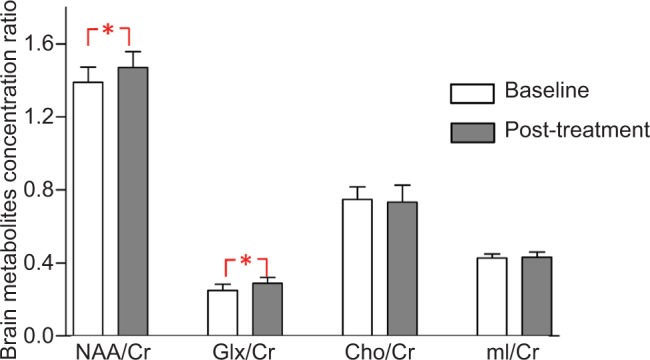
Figure 3.

Metabolite changes in the anterior cingulate cortex. Data are presented as mean of brain metabolites compared between baseline and post-tDCS treatment.
Notes: Vertical lines represent SD. *Represents significant difference P<0.01.
Abbreviations: Cho, choline; Cr, creatine; Glx, glutamine combined glutamate; mI, myoinositol; NAA, N-acetylaspartate; tDCS, transcranial direct current stimulation.
