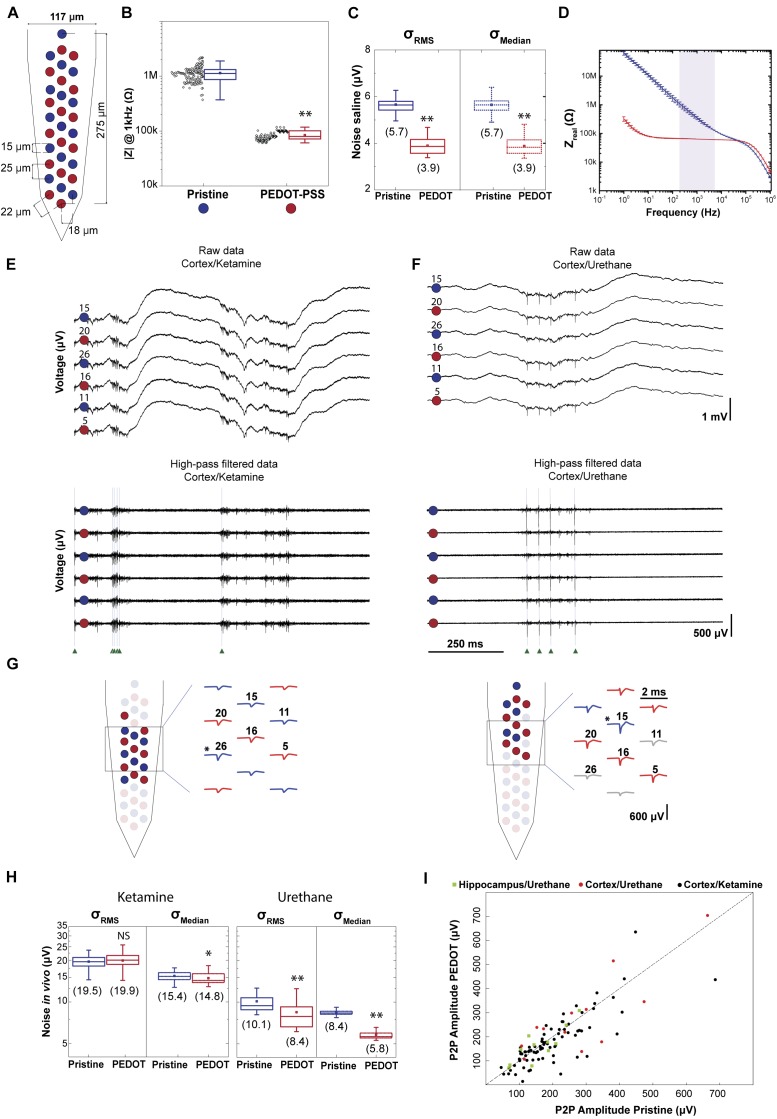
FIGURE 2.
Impact of impedance on data quality. (A) Schematic of a polytrode where electrodes were modified in a ‘chess board’ pattern. Red circles represent PEDOT-PSS coated electrodes and blue circles represent pristine electrodes. (B) Reliability of PEDOT-PSS electrodeposition protocol. Impedance magnitude measured at 1 kHz in saline solution for 3 polytrodes (npristine = 48 and nPEDOT = 48). Black points denote individual measurement for each electrode (3 measurements for each electrode). (C) Noise σRMS and σMedian of recordings performed in saline solution (npristine = 48 and nPEDOT = 48). Values in parentheses show mean value. (D) Impedance spectroscopy of PEDOT-PSS coated (n = 3) and pristine (n = 3) electrodes shows a significant decrease in the impedance real value. The light purple shaded area corresponds to the frequency range in which the thermal noise was computed. (E) 1 s-long raw data traces from 6 electrodes, 3 coated and 3 non-coated, from the recording ‘amplifier2014_11_25T23_00_08.bin’. This recording was carried out in cortex under ketamine anesthesia. Top: signals correspond to the 0.1–7.5 kHz frequency band. Bottom: high-pass filtered traces to highlight spontaneous spiking activity. Green arrows indicate the time of spikes identified for a putative neuron. (F) The same representation as in (E) for the recording ‘amplifier2017_02_02T15_49_35.bin’. This recording was carried out in cortex under urethane anesthesia. (G) Representative putative neurons from each of the recordings shown above. Left panel corresponds to the cortex/ketamine recording and right panel to the cortex/urethane recording. Schematic of two polytrodes with red and blue colored waveforms and circles denoting the electrodes with the highest peak-to-peak amplitudes from each unit, respectively. The asterisks indicates the electrode with the maximum amplitude P2P. (H) σRMS and σMedian of 9 acute recordings performed in rat cortex, 6 of which under ketamine, and 3 under urethane (nPEDOT_ket = 96, nPristine_ket = 96, nPEDOT_ure = 48 and nPristine_ure = 48). Values in parentheses show mean value. (I) The maximum P2P amplitude average for coated electrodes and for non-coated is plotted for 103 sorted neurons. In the boxplots, line: median, square: mean, box: 1st quartile–3rd quartile, and whiskers: 1.5× interquartile range above and below the box. ∗p < 0.001 when compared with pristine electrodes. ∗∗p < 0.0001 when compared with pristine electrodes. ‘NS’ not significant (p > 0.05) when compared with pristine electrodes.

