
FIGURE 2.
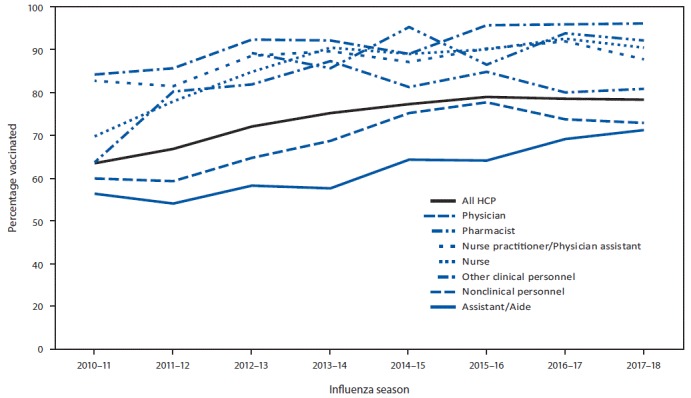
Percentage of health care personnel (HCP) who received influenza vaccination, by occupation* — Internet panel surveys,† United States, 2010–11 through 2017–18 influenza seasons
* In the 2010–11 season, dentists were included in the physician category. Before the 2012–13 season, separate data on pharmacists were not collected. Other clinical personnel category includes allied health professionals, technicians, and technologists. Nonclinical personnel category includes administrative support staff members or managers and nonclinical support staff members (e.g., food service workers, laundry workers, janitors, and other housekeeping and maintenance staff members).
† Respondents were recruited from two preexisting national opt-in Internet sources: Medscape, a medical website managed by WebMD Health Professional Network, and general population Internet panels operated by Survey Sampling International.