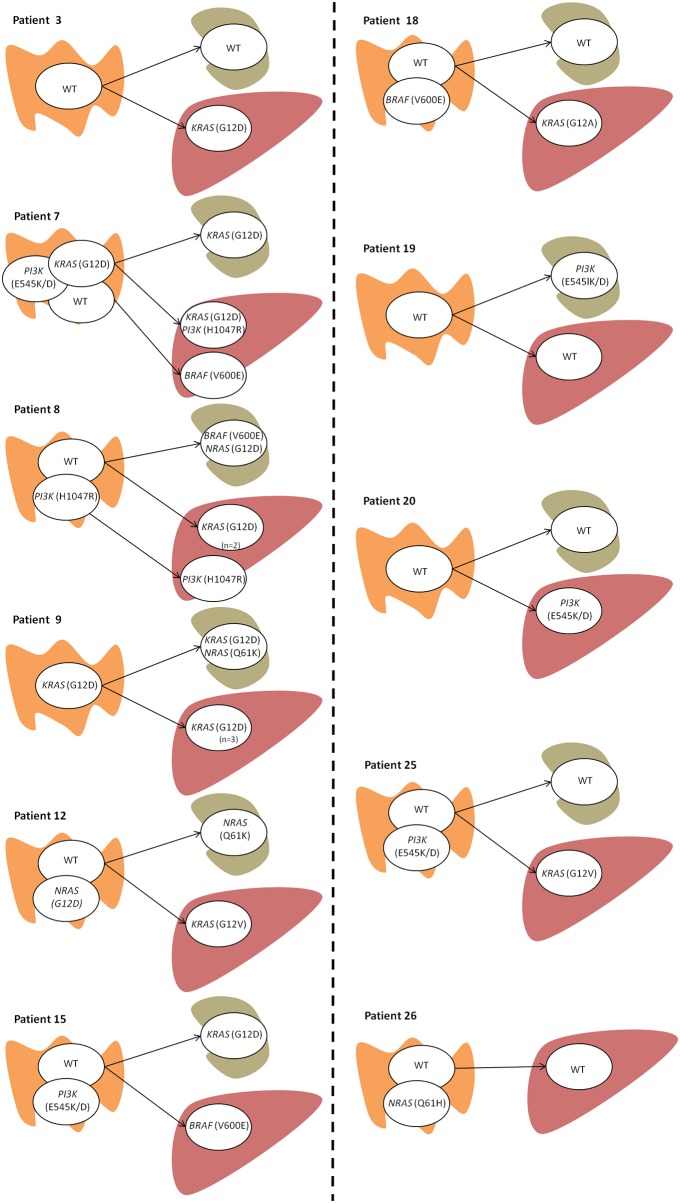
Figure 1. Intratumoral and intertumoral mutation heterogeneity of primary colorectal carcinomas as determined by the presence of different mutation status for KRAS, NRAS, PIK3 and BRAF genes.
Only those patients with mutation heterogeneity across the three tumor samples in one or more of the four examined genes are shown (n=11). A detailed description of all patients (n=26) and samples (number and type) analyzed can be found in Table 1. Each circle represents a tumor cell clone detected in the sample analyzed. Tissue origin in represented by the following pictures:  for the primary tumor;
  lymph node;
  liver metastasis. If more than one sample per tissue was studied it is mentioned in the figure (n= number of samples).

