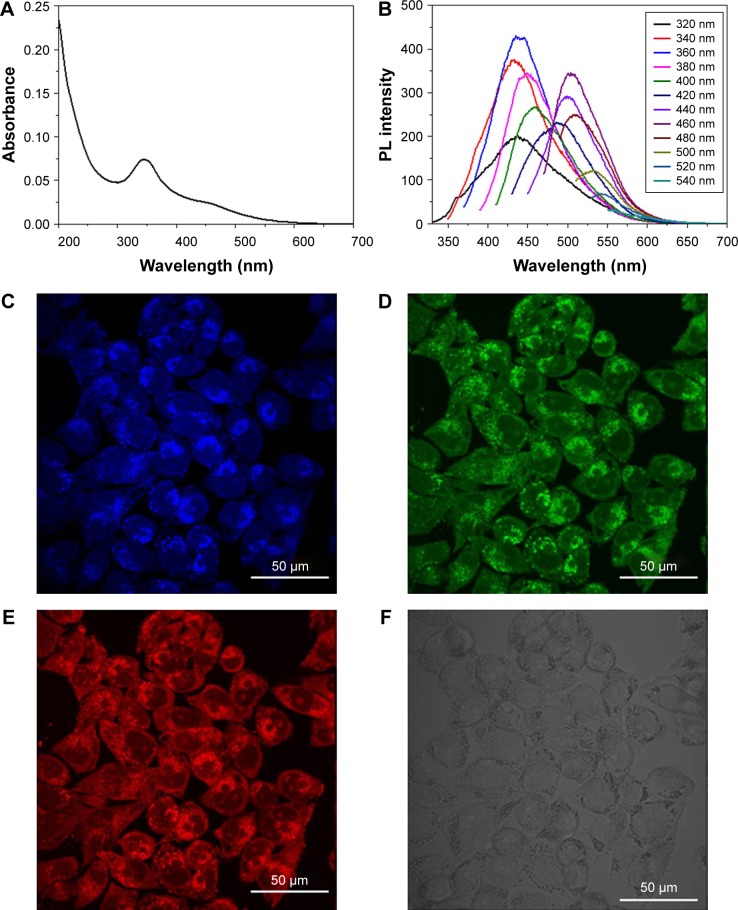
Figure 3.
Fluorescent properties and cell imaging of Re-CDs.
Notes: (A) UV–vis spectrum of Re-CDs. (B) The PL emission spectra of Re-CDs with progressively longer excitation wavelengths from 320 to 540 nm in 20 nm increments. (C–F) Cell imaging of A375 cells treated with Re-CDs under ultraviolet (C, 360–380 nm), blue (D, 460–480 nm), green (E, 510–530 nm) light excitation and bright field (F).
Abbreviations: PL, photoluminescence; Re-CDs, Re-based carbon dots; UV–vis, ultraviolet–visible.

