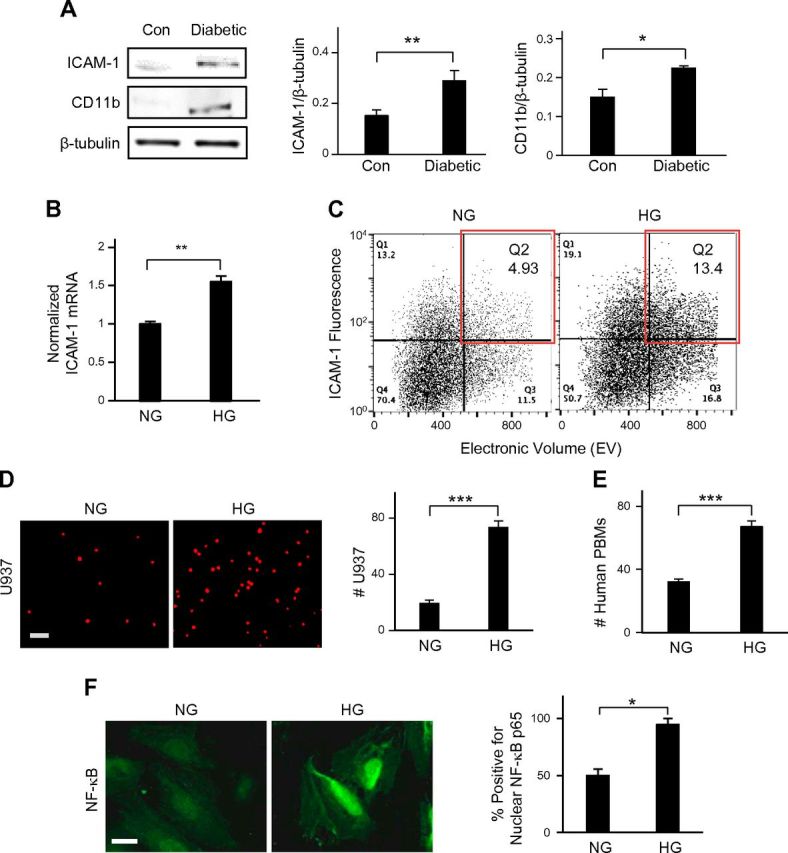
Figure 1.

Retinal endothelial activation is a chief characteristic of diabetes. A) Representative Western blot bands and their densitometric analyses (bar graphs) together revealed that the levels of ICAM-1 in ECs and CD11b in monocytes/macrophages were significantly higher in diabetic mouse retinas vs. control retinas (n = 5). *P < 0.05; **P < 0.01. ICAM-1 and CD11b levels were normalized with respect to the corresponding levels of β-tubulin (loading control). B) In real-time RT-PCR analysis, HG-treated retinal EC cultures exhibited a 60% increase in ICAM-1 mRNA expression vs. NG-treated cells. **P < 0.01. ICAM-1 mRNA levels were normalized with respect to NG levels. C) Surface expression of endothelial ICAM-1 was determined by flow cytometry. Quantitative dot plot analysis of representative fluorescence vs. size (electronic volume) indicated that HG treatment produced an ∼2.7-fold increase in the number of high ICAM-1–expressing ECs (red box) than was produced by NG treatment. D and E) Fluorescence-labeled U937 cells or freshly isolated human PBMs were added to the EC monolayer for 30 min. Representative fluorescent images of adherent U937 cells or human PBMs and subsequent cell count indicated a significant (2.1- to 3.5-fold) increase in monocyte–EC adhesion in HG conditions. Data are averages ± sem (per square millimeter) from multiple images of monocyte–EC cocultures (n ≥ 10). Scale bar, 100 μm. ***P < 0.001. F) Representative fluorescent images of NG- and HG-treated ECs labeled with anti–NF-κB p65 and quantification of percent total cells (bar graph; n ≥ 20 cells) with NF-κB p65 nuclear translocation revealed significantly greater incidence of NF-κB activation in HG- vs. NG-treated ECs. Significance was determined by unpaired Student’s t test, followed by Welch correction, and confirmed by Pearson’s correlation analysis. *P < 0.05. Scale bar, 20 µm.
