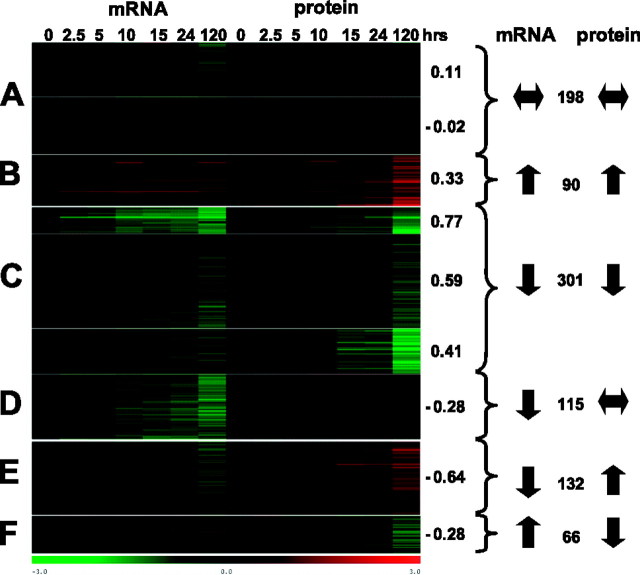
Figure 2.
Cluster analysis of mRNA and protein coexpression during Leishmania differentiation. K-median clustering of mRNA and protein abundance changes were performed using TMeV software (36) to produce 9 clusters with 6 different patterns (letters A–F at left). Average correlation coefficient (as determined for each gene as described in Materials and Methods) is at right of each cluster. Number of genes in each cluster pattern is at far right, between arrows indicating the change in mRNA and protein abundance.

