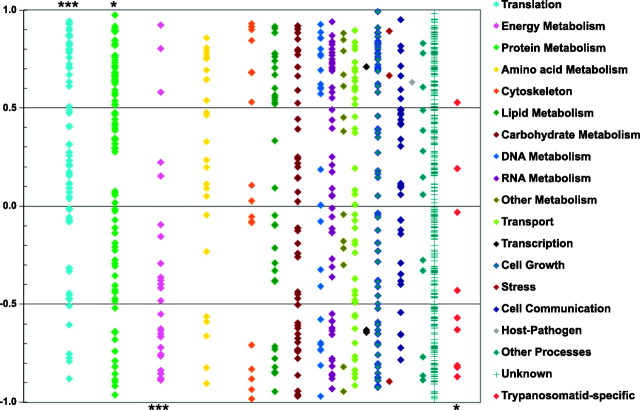
Figure 6.
Correlation between changes in mRNA and protein levels by GO Slim category. All 902 genes were categorized into a single GO Slim Plus category (indicated in the legend at right), as described by Ivens et al. (24). Correlation coefficient for each gene was calculated as described in Materials and Methods; Student's t test (in Microsoft Excel) was used to calculate whether the mean for each GO Slim Plus class was significantly different from that of the 902 genes as a whole. Classes with statistically significant differences are indicated by asterisks either above (positive correlation) or below (negative correlation) the relevant column: *P < 0.02; ***P < 0.001.

