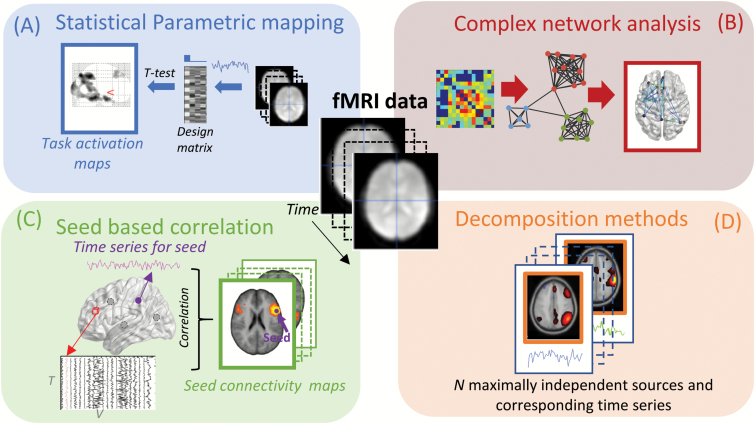
Fig. 2.
Sketch of 4 feature extraction methods for fMRI. Panel A illustrates statistical parametric mapping, where information about the experimental design is used to test for significant activation in each voxel using a general linear model. Panel B sketches complex network analysis. Here, a network is derived by determining functional connectivity between parcellated brain regions, followed by analysis using graph theoretical measures. In panel C, the seed based correlation approach is illustrated, here the time series from a predetermined brain region is extracted and correlated to the rest of the brain. In panel D, decomposition methods are illustrated where fMRI data are decomposed into spatially independent components with corresponding time series.

