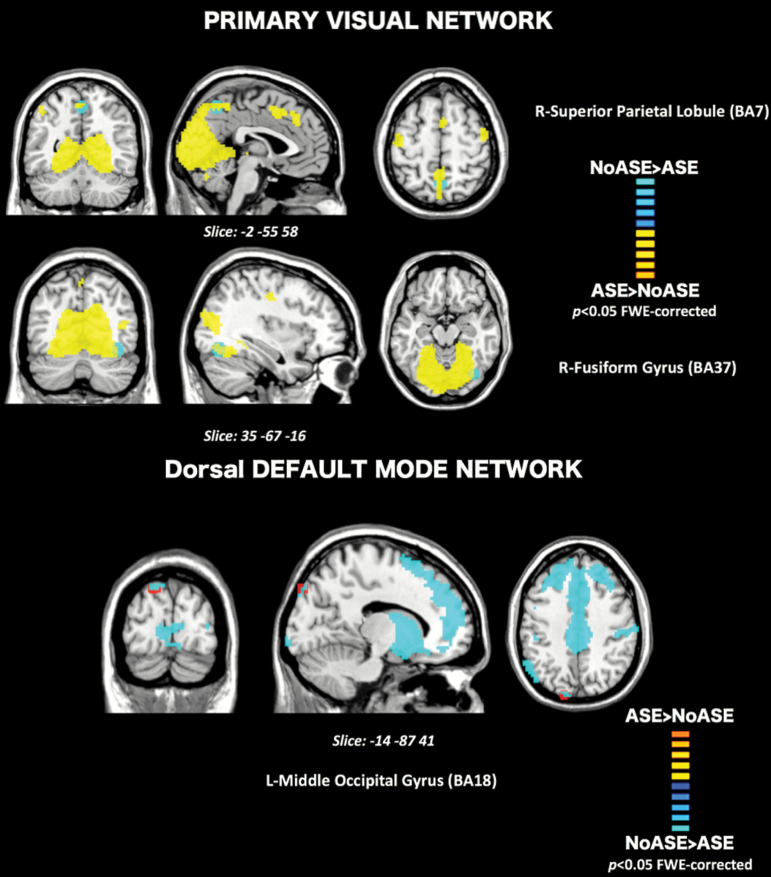
Fig. 2.
Cross-sectional rs-fMRI: Top: Connectivity differences within the Primary Visual Network (PVN) for the contrast NoASE>ASE (Blue) showed connectivity differences in BA7 and BA37. Bottom: Within the Default Mode Network, the contrast ASE>NoASE (Red) showed connectivity differences in BA18. Results are clustered for family wise errors (P < .05) and overlaid on their respective components’ maps (Yellow = PVN, Blue = dDMN).

