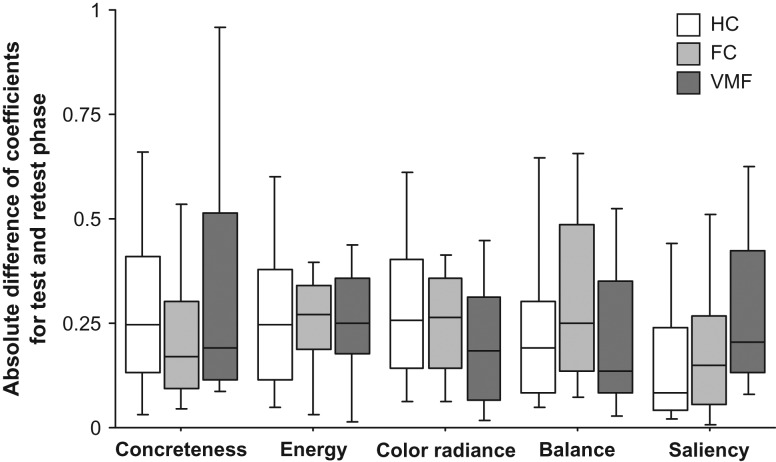
Figure 5.
Consistency of relationship between value ratings and artwork components in healthy controls (HC), frontal lobe damaged controls (FC), and the ventromedial frontal lobe damaged group (VMF). Absolute difference between individual coefficients estimated for relationship between components during test and retest phase of the value rating task. Box plots show the 10th, 25th, 50th, 75th and 90th percentiles of data.

