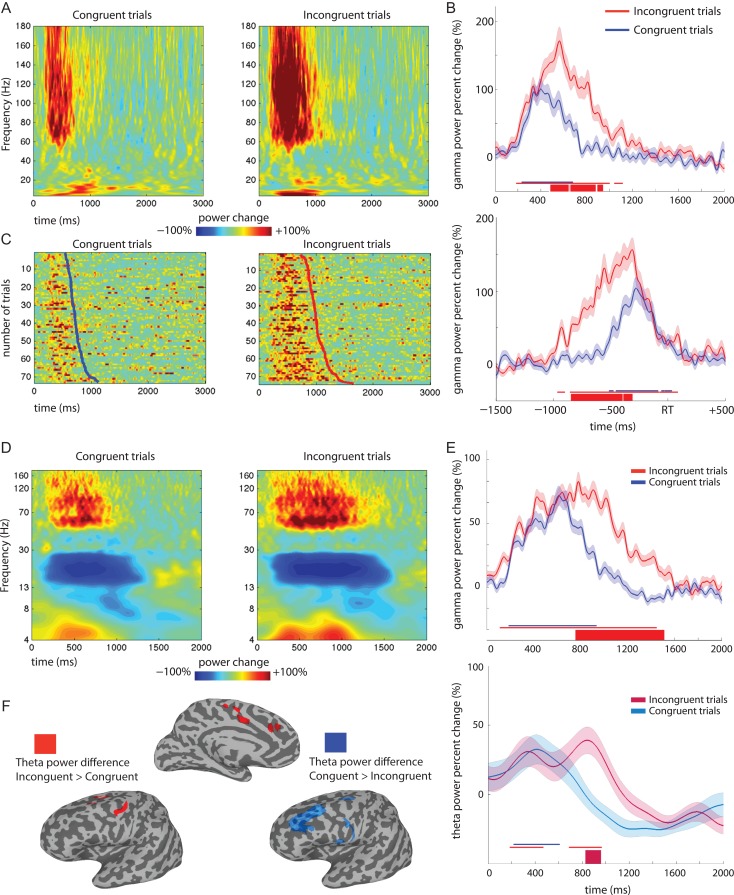
Figure 3.
Response profiles and conflict-sensitivity. (A–C) Example of 1 typical MFG electrode. (A) Averaged time-frequency plot of the whole spectrum for congruent and incongruent trials. Data are shown from stimulus onset (at 0 ms on the x-axis) to 3 s after stimulus onset. (B) Time traces of gamma power (50–150 Hz) change for incongruent (red) and congruent (blue), locked to stimulus onset (upper) and response time (lower). Shading around the traces represents one standard error of the mean at each time-point. The thin colored lines above the x-axis show the time points at which the gamma power was statistically different from baseline and are used to report the onset and duration of response. The thick line represents time points with a significant difference in gamma power between congruent and incongruent trials (used to define conflict sensitivity, and its timing). (C) Raster plots of single-trial gamma power sorted by RT (solid line) showing congruent and incongruent trials. (D) Time-frequency maps of power change shown for 1 electrode recording from the cingulate sulcus (patient 8) during congruent and incongruent trials. Frequency (y-axis) is represented using a log-scale to elaborate contributions of lower frequencies. (E) Time traces of gamma (upper) and theta (lower) power change at the same CS electrode (patient 8). Shadings around traces represent one standard error of the mean at each time-point. The thin colored lines above the x-axis show the time points at which the gamma power was statistically different from baseline and are used to report the onset and duration of response. The thick line represents time points with a significant difference in gamma power between congruent and incongruent trials (used to define conflict sensitivity, and its timing) Note that the onset of conflict sensitivity is similar across the 2 frequency bands, while lasting longer for gamma. (F) Surface-based representation of electrode locations showing a difference in theta power between congruent and incongruent trials. In red are shown the locations where theta power is higher for incongruent trials, in blue for congruent trials.

