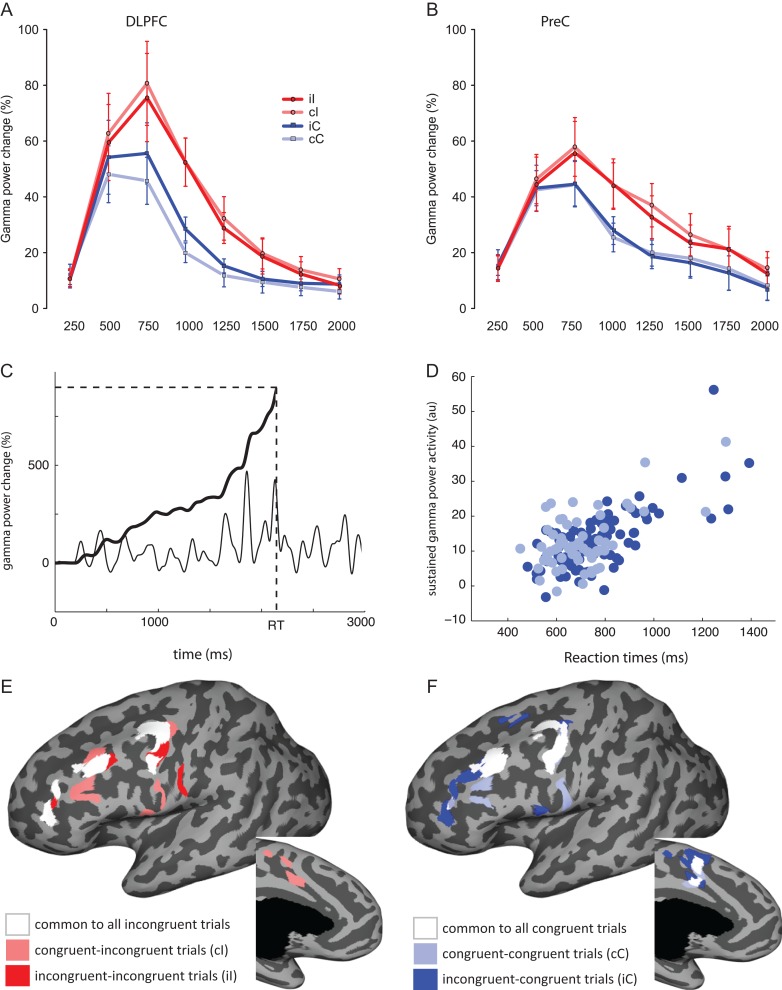
Figure 4.
Conflict and trial-by-trial modulations. (A) DLPFC. (B) PreC. In both panels, the y-axis represents gamma power percent change. The x-axis represents averaged values in 250 ms wide time bins (e.g., 250 refers to an average of values between 0 and 250 ms, and so on). Red and blue traces (with circles and squares as markers) represent incongruent and congruent conditions respectively. Light-color traces represent the postcongruent trials (cI in light red and cC in light blue), saturated-color traces the postincongruent trials (iI in red and iC in blue). Bars represent standard error of the mean. (C) example of single-trial gamma power change (black thin line) integrated over time (black thick line) from stimulus onset (0 ms) to the RT (dashed vertical line) to obtained the cumulative gamma power value (horizontal dashed line) that is used as an index of sustained gamma activity. (D) Example of the correlation between gamma power cumulative values and RTs calculated on one electrode using congruent trials (cC and iC, in light blue and dark blue) separately. (E, F) Surface-based representation of the regions exhibiting a significant correlation (for the left hemisphere only, both lateral and medial views) between gamma power and RTs considering incongruent trials (E: cI in light red; iI in dark red; common to both in white) and for congruent trials (F: cC in light blue; iC in dark blue; common to both in white).

