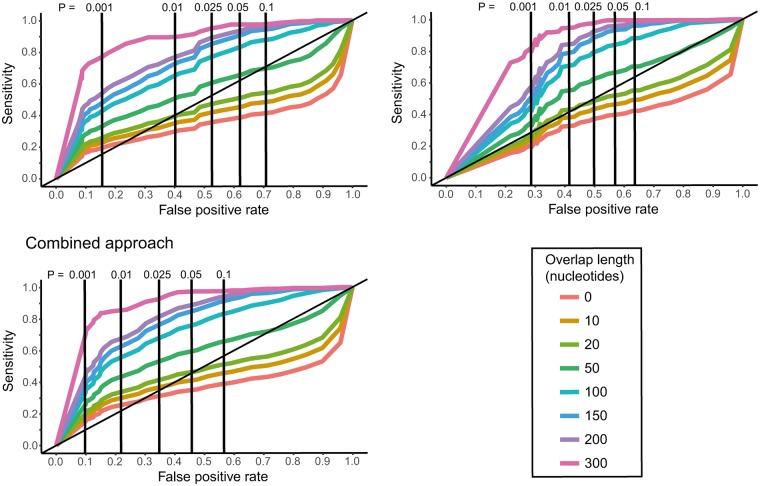
Fig. 3.
Receiver operator characteristic curves showing the sensitivity and false discovery rate of each test, for different P value cut-off values, and different minimum overlapping lengths in nucleotides. Table 1 shows the precise values for this for minimum overlapping lengths of 50, 100, 200, and 300 nucleotides, and P value cutoffs of 0.01 and 0.001.

