
Fig. 3.
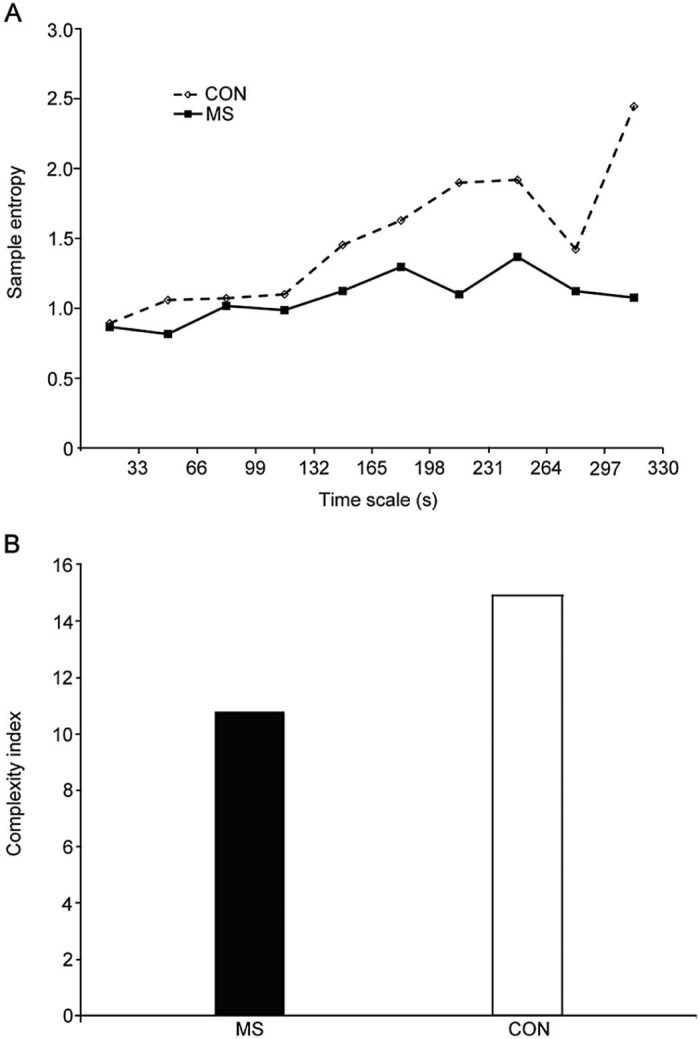
Plots from representative individuals with (MS) and without (CON) multiple sclerosis. (A) Sample entropy and (B) Complexity index from a 30-s trial where sample entropy was calculated for 10 time scales.
Official websites use .gov
A
.gov website belongs to an official
government organization in the United States.
Secure .gov websites use HTTPS
A lock (
) or https:// means you've safely
connected to the .gov website. Share sensitive
information only on official, secure websites.
Plots from representative individuals with (MS) and without (CON) multiple sclerosis. (A) Sample entropy and (B) Complexity index from a 30-s trial where sample entropy was calculated for 10 time scales.